📑 챕터 바로가기
추정의 계층 구조 — 수준 · 위상 · 편차
- 수준 L(p). 외부(KNHANES 가중회귀)+설문+day1 보정을 shrinkage로 합친 사람별 평균 혈압 — 2-1·2-2·2-3
- 위상. 일주기 phase 커널. 수준과 합쳐 E0 = 수준 + 위상 (구조적 추정치) — 2-4
- 편차 r = 실측 − E0. 워치(급성 생리)로 남은 편차를 모델(과거 BP추정변수 제외) — 2-5 · 편차모델
- 최종 = E0 + r̂. 분단위로 출력, 세션·일평균으로 집계, 실측에서 평가
외부데이터 — KNHANES 앵커
신규 환자는 과거 혈압이 없다. 그래서 국민건강영양조사(KNHANES)를 외부 앵커로 — 나이·성별·BMI·설문 변수로 가중회귀해 그 사람의 모집단 기대 수준 Lext를 만든다. 내부 코호트가 작아도(120명) 외부 분포로 수준을 안정화하는 shrinkage의 바깥쪽 닻이다.
내부데이터 — 장비 offset 정렬
KNHANES는 표준 cuff, 우리는 다른 장비·프로토콜이다. 둘의 측정 scale 차이를 내부 train 코호트로 offset α를 적합해 정렬한다 — Lext를 우리 장비 단위로 옮기는 보정. 내부데이터는 또한 위상 커널·편차 모델의 학습원이다(train 사람 days2-7).
1-day calibration — 개인 닻
day1(첫날) 측정만 보정에 쓴다(이후 실측 과거 BP는 금지). day1 평균 cm을 외부 수준 Lext로 shrink해 사람별 level을 잡는다. day1이 많을수록(n↑) 개인값을, 적을수록 외부 앵커를 더 믿는 경험적 베이즈 구조.
위상 커널 — 일주기 추정
혈압은 하루 주기로 오르내린다(낮 높고 새벽 낮음). 같은 시간대(time-of-day)일수록 큰 가중치를 주는 phase 커널로 일주기를 복원해 수준에 더한다. 하루는 1440분 원이라 circular 거리를 쓴다.
· 보간(PART1): 그날 자기 실측점을 좁은 커널(ℓ=90·κ=0.5)로 연결 → 실제 그날 리듬 재현.
· 추정(PART2): 신규 환자는 그날 측정이 하나도 없다. 그래서 위상을 E0 = 수준 + [α·(day1 위상·최근성 가중 편차) + (1−α)·(집단 평균 일주기)] 로 만든다. day1 점을 recency(τ)×phase(ℓ=196)로 가중하되, α = W/(W+κ), κ=5라 확신이 낮고, 목표가 day1에서 멀수록 recency가 죽어 α→0 → 사실상 집단(연령×성별) 평균 일주기를 차용한다.
와치 — 변수 하나하나 (핵심)
편차의 급성 동인은 워치다. 엑셀 26시트(Info·BP + 24개 신호)를 한 장씩 점검했다. 신호마다 측정 빈도·해상도가 천차만별 — 분단위급(HR·에너지·METs·걸음)부터 sparse(HRV·SpO2·손목온도)까지. 아래는 120명 집계 기초통계.
| 워치 변수 | 단위 | 측정/주·명 | 커버% | 평균±SD | 범위 | 밀도 |
|---|---|---|---|---|---|---|
| 심박수 HR | BPM | 4,462 | 100 | 75.2±13.5 | 43–141 | 고밀도 |
| 활동 에너지 | kcal | 3,753 | 100 | 3.9±3.5 | 0–32 | 고밀도 |
| 휴식 에너지 | kcal | 3,720 | 100 | 17.4±8.2 | 0.1–86.6 | 고밀도 |
| 절대적 운동강도 METs | MET | 3,361 | 100 | 1.8±1.0 | 1–12 | 고밀도 |
| 걷기+달리기 거리 | km | 2,242 | 100 | 0.1±0.1 | 0–0.7 | 고밀도 |
| 걸음 | steps | 1,175 | 100 | 96.6±124.2 | 1–1056 | 고밀도 |
| 일어서기 시간(분) | 분 | 357 | 100 | 1.7±1.0 | 1–5 | 중밀도 |
| 호흡수 | /min | 273 | 99 | 15.5±2.8 | 7.5–32.5 | 중밀도 |
| 운동하기 시간 | 분 | 239 | 97 | 1.0±0.0 | 1 | 중밀도 |
| 보행 보폭 / 속도 | cm·m/s | 213 | 98 | 63.4 / 1.1 | 25–132 | 중밀도 |
| 수면 | 단계 | 205 | 99 | 3.2±1.2 | 0–5 | 중밀도 |
| 이중 지지 시간 | s | 190 | 98 | 0.3±0.0 | 0.2–0.4 | 중밀도 |
| 보행 비대칭성 | % | 102 | 98 | 0.04±0.1 | 0–1 | 중밀도 |
| 혈중 산소 SpO2 | % | 113 | 100 | 1.0(=100%) | 0.8–1.0 | 중밀도 |
| 심박 변이 HRV | ms | 80 | 100 | 45.2±24.8 | 0–221 | 저밀도 |
| 오른 층수 | 층 | 34 | 94 | 1.9±1.5 | 1–17 | 저밀도 |
| 계단 올라가기 속도 | m/s | 21 | 87 | 0.3±0.1 | 0.2–1.1 | 저밀도 |
| 일광 시간 | 시간 | 20 | 78 | 2.9±1.5 | 1–5 | 저밀도 |
| 휴식기 / 걷기 심박수 | BPM | 7 | 100 | 63.1 / 98.5 | 44–146 | 저밀도 |
| 손목 온도 | °C | 3 | 50 | 35.6±0.5 | 34.3–38.2 | 저밀도 |
| 보행 안정성 | - | 0 | 76 | 0.9±0.1 | 0.7–1.0 | 저밀도 |
생성과정 — 원신호를 모형 변수로 (어떻게 만드나)
편차 모델에 실제로 들어가는 8개 워치 변수는 원신호를 이렇게 가공해 만든다(쉬운 말로).
- 심박수 HR — 그 세션의 마지막 심박수 값. 가장 기본 신호.
- 가중 심박수 kwHR — 그 시점 주변 심박수를 커널로 평균낸 값(순간 튐을 눌러 매끈하게).
- ΔHR(안정 대비) dHR — HR − 안정심박. 안정심박은 그 사람 HR의 하위 10%(휴식 수준)로 잡는다. "지금 얼마나 각성/활동 중인가"를 뜻함 — 편차의 최강 신호.
- 심박변이 HRV — 심박 간격의 흔들림(자율신경 상태). 낮으면 교감신경 우위(스트레스).
- 손목 온도 WT — 손목 피부 온도. 말초 혈관 수축/저항(TPR)의 대리 — 추우면 수축→혈압↑.
- 운동강도 METs — 절대적 운동 강도(대사당량). 활동성 급성 부하.
- 활동 active — METs≥3 또는 걸음≥300이면 1(움직이는 중).
- 수면 sleep — 밤(00~06시·22~24시)이면서 비활동이면 1(자는 중, 야간 혈압 저하 반영).
변수별 BP 관계 · 선행연구 레퍼런스
각 워치 변수가 혈압과 어떻게·왜 연결되는지(방향·기전)와 핵심 인용. (다중 에이전트 문헌조사 기반)
- Schroeder EB, Liao D, Chambless LE, et al. 2003, Hypertension (ARIC Study) 42(6):1106-1114. Cohort 11,061 (age 45-64); cross-sectionally HRV (SDNN, RMSSD, R-R) lower in hypertensives across the FULL BP range after adjustment. Prospectively among 7,099 normotensives at baseline, low HRV predicted incident hypertension over ~9 yr: lowest vs highest quartile HR 1.24 (95% CI 1.10-1.40) for SDNN, 1.36 (1.21-1.54) for RMSSD, 1.44 (1.27-1.63) for R-R interval. Establishes the temporal sequence: low HRV precedes hypertension.
- Singh JP, Larson MG, Tsuji H, et al. 1998, Hypertension (Framingham Heart Study) 32(2):293-297. 931 men + 1111 women, first 2h ambulatory ECG. Cross-sectionally HRV significantly lower in hypertensive men and women. Prospectively (4-yr follow-up, 633 men/801 women normotensive at baseline; 119 men/125 women became hypertensive): low LF power predicted new-onset hypertension in MEN (not women); in men LF was a stronger predictor than BMI. Sex-specific direction.
- Schroeder EB et al. 2003, Hypertension (ARIC): crude SDNN, RMSSD, and R-R lower in hypertensives vs normotensives, persisting after adjustment (age, sex, race, center, diabetes, smoking, education, BMI). Lowest-quartile hazard ratios for incident hypertension — SDNN 1.24, RMSSD 1.36, R-R 1.44 (see above).
- ELSA-Brasil — Almeida-Santos / Brazilian Longitudinal Study of Adult Health, 2021, J Hum Hypertens (Nature) — prospective, 7,665 normotensive at baseline, 4-yr follow-up. Low values of HRV indices (SDNN, VLF, LF) significantly associated with increased relative risk of incident hypertension after full adjustment; even normal-BP (not just prehypertensive) subjects with low SDNN/VLF/LF were at increased risk. Conclusion: cardioautonomic disturbance precedes clinical hypertension.
- Liao D et al. 1996, Am J Hypertens (ARIC): graded inverse HF-to-incident-hypertension association, lowest HF quartile OR 2.44 (1.15-5.20).
- Singh JP et al. 1998, Hypertension (Framingham): low LF predicted incident hypertension in men.
- AHA Hypertension — 'Baroreflex Sensitivity Inversely Correlates With Ambulatory Blood Pressure in Healthy Normotensive Humans' (ahajournals.org HYPERTENSIONAHA.107.090308): lower BRS associated with higher ambulatory BP even within normotensive range.
- Crisafulli A et al. 2022, 'Hypertension depresses arterial baroreflex control of heart rate and cardiac output during rest, exercise, and metaboreflex activation' (PMC9602692): hypertensives have blunted baroreflex control of heart period; baroreflex reset to higher pressure at cost of reduced sensitivity.
- Hillebrand S, Gast KB, de Mutsert R, et al. 2013, Europace 15(5):742-749 — meta-analysis & dose-response meta-regression of HRV and first CV event in populations without known CVD: pooled RR (lowest vs highest SDNN) 1.35 (95% CI 1.10-1.67); LF 1.45 (1.12-1.87); HF 1.32 (0.96-1.81). A 1-SD lower SDNN ~ 32-45% higher CV risk.
- General meta-analytic finding cited across reviews: lower HRV associated with higher all-cause death / CV events in CVD patients (pooled HR for all-cause death ~2.27) — larger effect in diseased populations vs primary-prevention cohorts.
- Peppard et al. 2000, N Engl J Med (Wisconsin Sleep Cohort) — dose-response, BMI-independent: baseline AHI≥15 vs 0 gave ~4-year adjusted OR ≈2.89 (95% CI 1.46-5.64) for incident hypertension; AHI≥15 ~3.2-fold higher odds vs no OSA
- Tamisier et al. 2011, Am J Physiol Heart Circ Physiol — controlled chronic intermittent hypoxia 9h/night x28 nights in healthy young adults: diastolic BP rose 71±1.3→74±1.7 mmHg (P<0.01); MSNA rose 9.94→14.63 bursts/min (P<0.05); demonstrates causal hypoxia→BP+sympathetic link
- Joseph et al. 2005, Hypertension 46:714-718 — slow breathing 6/min in essential hypertensives: SBP 149.7±3.7→141.1±4 (P<0.05), DBP 82.7±3→77.8±3.7 mmHg (P<0.01); baroreflex sensitivity rose 5.8±0.7→10.3±2.0 ms/mmHg (hypertensives) and 10.9→16.0 (controls); reduced sympathetic/chemoreflex activation
- Mahtani et al. 2012, J Hum Hypertens (RESPeRATE device meta-analysis, 8 trials, n=494) — SBP −3.67 mmHg (95% CI −5.99 to −1.39, P=0.002), DBP −2.51 mmHg (−4.15 to −0.87, P=0.003); BUT effect null after excluding manufacturer-linked trials
- Baroreflex Sensitivity Inversely Correlates With Ambulatory Blood Pressure in Healthy Normotensive Humans, Hypertension (AHA, ahajournals.org/doi/10.1161/HYPERTENSIONAHA.107.090308) — baroreflex enforces inverse SBP-HR relation; baroreflex sensitivity inversely correlates with ambulatory BP in normotensives.
- Human/animal baroreflex reviews (PMC9602692; Fadel et al., PMC3253263 'Human Investigations into the Arterial and Cardiopulmonary Baroreflexes during Exercise') — during exercise the arterial baroreflex resets in direct proportion to intensity, allowing parallel rises in BP and HR to raise cardiac output; exercise pressor/metaboreflex raises BP via increased HR, contractility (Emax), and CO.
- Wang et al. (or cohort authors), 'Association of Resting Heart Rate With Blood Pressure and Incident Hypertension Over 30 Years in Black and White Adults: The CARDIA Study,' Hypertension, Sept 2020 (AHA, HYPERTENSIONAHA.120.15233; PMC7430042) — n=3888 (1615 men, 2273 women) followed ~30 yrs; HR per +10 bpm RHR = 1.47 (1.23-1.75) Black men, 1.51 (1.28-1.78) White men, 1.48 (1.26-1.73) White women, 1.02 (0.89-1.17, NS) Black women.
- Dose-response meta-analysis of cohort studies (PMC7478507) — linear positive association; ~9% higher incident-HTN RR per +10 bpm; RHR ~100 vs 55.5 bpm = RR 1.58 (1.32-1.88); no significant association in women subgroup.
- Sharashova et al., 'Association of exercise heart rate response and incidence of hypertension in men,' (PubMed 24974261) — higher HR reserve protective: HR 0.84 (95% CI 0.74-0.95) for highest vs lowest quartile of HR reserve for incident hypertension in men.
- Singh JP et al., 'Blood Pressure Response to Heart Rate During Exercise Test and Risk of Future Hypertension,' Hypertension 2002 (AHA hy0302.105777; PubMed 11897759) — Framingham-related; n~1033 normotensive men, mean age ~43; steeper BP-response-to-HR slope (and percentile curves via 3rd-order polynomial regression) predicts future hypertension; exaggerated exercise BP response RR ~3.8 (2.3-6.1) for incident HTN.
- Evaluation of a novel cuffless PPG-based wristband for measuring blood pressure per regulatory standards, Eur Heart J Digital Health 2024 (academic.oup.com/ehjdh/article/5/3/335; PMC11104472) — algorithm errors ~+/-3.7 (SD 4.4) mmHg SBP and +/-2.5 (SD 3.7) mmHg DBP; requires cuff initialization + ~100 features.
- Frontiers Med Technol 2024 (10.3389/fmedt.2024.1464473) PPG cuffless bracelet — SBP mean diff 0.5 (SD 7.8) mmHg sitting, -2.4 (10.1) supine, -0.6 (12.5) standing; accuracy posture-dependent.
- Veronese N et al. 2018, J Am Med Dir Assoc (JAMDA) — meta-analysis, 45 studies / ~101,945 adults (mean age 72.2y, median FU 5.4y): each 0.1 m/s SLOWER gait = +12% all-cause mortality (HR 1.12, 95%CI 1.09-1.14) and +8% CVD (HR 1.08, 95%CI 1.03-1.13).
- LaCroix AZ / WHI 2020, Hypertension (HYPERTENSIONAHA.120.15839) — 83,435 postmenopausal women, mean 11y FU, 38,230 incident treated-HTN cases: faster usual walking speed inversely associated with incident treated hypertension; HRs by pace ~1.00 (<2 mph, ref), 0.95, 0.86, 0.79 (>4 mph); significant after adjusting for baseline BP and walking volume.
- Stride Length Predicts Adverse Clinical Events — Systematic Review & Meta-analysis 2021, PMC8235531: short stride length predicted major adverse events (pooled OR 1.36) and physical disability (OR 1.26) in older adults.
- Frailty/gait studies (Frontiers Med 2026, 3389/fmed.2026.1785926) — frail older adults show shorter step length, prolonged double-support, and reduced gait speed vs robust; frailty phenotype associates with higher CV risk.
- Determining characteristics of gait variability at preferred speed in hypertensive vs normotensive participants 2023, J Clin Hypertens (S2213-3981(23)00131-8) — hypertensive participants: slower speed, longer double-support time, and significantly greater gait variability than normotensives.
- Medical, Sensorimotor & Cognitive Factors Associated with Gait Variability — longitudinal population study, PMC6305368: baseline CVD increased rate of change of step-length variability; weaker quadriceps increased step-width variability change.
- Effect of PAD & intermittent claudication on gait regularity and symmetry 2022, J Biomech (PubMed 35759975 / S0021-9290(22)00248-2): gait asymmetry increased after claudication onset; ML asymmetry and vertical stride regularity correlated with ankle-brachial index (ABI) and ABI asymmetry.
- Gait pattern in patients with PAD 2018, BMC Geriatrics (PMC5819174): reduced gait speed, step/stride regularity vs controls; affected limb longer swing, shorter stance.
- Paddock S et al. 2024, Eur J Prev Cardiol (zwae175.405) — systematic review/meta-analysis, 9 studies / 480,520 participants (pooled 5 studies, 455,649): stair climbing associated with 24% lower all-cause mortality and 39% lower CVD mortality; pooled CV-mortality RR 0.65 (95%CI 0.50-0.83).
- Daily stair climbing, disease susceptibility & ASCVD — prospective cohort 2023 (S0021-9150(23)05221-8): climbing >5 flights (~50 steps)/day associated with lower ASCVD risk independent of genetic susceptibility.
- Barone Gibbs B et al. 2024, Circulation (RESET-BP RCT, CIRCULATIONAHA.123.068564) — reducing sedentary behavior lowered BP in desk workers; companion analysis (WVU 2024) — increasing standing ~1 h/day for 3 months did NOT reduce BP or arterial stiffness.
- Prolonged Sitting Induces Elevated BP in Healthy Young Men — RCT crossover 2024, PMC10981358; and Single Bout of Prolonged Sitting Augments Very Short-Term BP Variability 2024, Am J Hypertens (PMC11322278) — acute sitting raises BP / BP variability.
- Wang et al. 2022, Hypertension (AHA) 'Inverse Association of Skin Temperature With Ambulatory Blood Pressure...' (Nara Medical Univ.) — n=584 older adults, 48h ABPM + skin temp (30,711 daytime / 17,382 nighttime readings, Oct–Mar). Distal (wrist+ankle) and proximal (abdomen) skin temp inversely associated with daytime SBP: −4.27 mmHg (95% CI −4.58 to −3.96) and −2.74 mmHg per SD of skin temp; associations also significant at night; skin temp mediated BP responses to ambient temperature (path analysis). PMID 35574922; DOI 10.1161/HYPERTENSIONAHA.122.19190
- Blázquez/Sarabia/Madrid et al. 2012, Chronobiology International 29(6):747 'Wrist Skin Temperature, Motor Activity, and Body Position as Determinants of the Circadian Pattern of Blood Pressure' — wrist temp negatively correlated with SBP/DBP; 78.6% concordance between observed BP dips and BP pattern predicted from wrist-temperature rhythm. PMID 22734575
- Weller/Feelisch et al. 2020, JAHA 9(5):e013837 'Does Incident Solar Ultraviolet Radiation Lower Blood Pressure?' — large N. American chronic hemodialysis cohort; higher incident solar UV associated with lower SBP after adjusting for ambient temperature; supports UV->cutaneous NO->lower BP mechanism. PMC7335547
- Liedtke/… 2023, Scientific Reports 13 (Nature) 'Low-dose daylight exposure induces nitric oxide release and maintains cell viability in vitro' — mechanistic support that daylight-level exposure triggers NO release. DOI 10.1038/s41598-023-43653-2
- Lo, Woo et al. 2018, Journal of Clinical Hypertension 20(3):592 'Subjective sleep quality, blood pressure, and hypertension: a meta-analysis' — 29 articles/45,041 patients; poor sleep quality associated with hypertension (OR 1.48, P=.01); highest sleep-disturbance tertile OR 1.44 (1.00–1.64); poor sleepers higher SBP (MD 4.37) and DBP (MD 1.25) (NS). Notes dippers have better subjective sleep quality than non-dippers. PMID 29457339
- Gangwisch et al. 2006, Hypertension (NHANES I, n≈4,810, 8–10y) — sleep ≤5 h/night raised incident hypertension (adjusted HR 1.32, 95% CI 1.02–1.71 vs 7–8h); ages 32–59 with ≤5h ~60% more likely to develop hypertension.
- del Pozo Cruz et al. 2024, Eur J Prev Cardiol — UK Biobank hypertensives (n≈32,192): each +1,000 steps/day vs ~2,300 baseline ~17% lower MACE risk.
- Chen et al. 2024, JMIR — higher wearable daily steps associated with lower SBP/DBP/MAP/pulse pressure in older adults; greater step variability linked to higher BP.
- Stamatakis et al. (ProPASS) 2025, Circulation (n=14,761) — reallocating time toward exercise-like activity yields clinically meaningful BP reductions (≥2 mmHg SBP).
- Liu et al. 2017, Hypertension — ~6% lower hypertension risk per 10 MET-h/week of leisure-time activity.
- Weyer et al. 2000, Hypertension — obese hypertensives show significantly higher RMR vs BMI-matched normotensives.
- MR study 2023, Sci Rep — genetically higher BMR causally raises heart failure / aortic aneurysm risk (adverse CV direction).
- Network meta-analysis 2023, Sci Rep — HIIT ~690 MET-min/week most effective for SBP (−5.07 mmHg); ~830 MET-min/week best for DBP (−4.42 mmHg).
- Pescatello et al. (ACSM) — regular aerobic exercise lowers BP ~5–7 mmHg in hypertensives.
- Resistant-HTN RCT 2021 (PMC8340008) — 12 wk of 3×40-min/week reduced 24-h and daytime ambulatory SBP/DBP.
- Halliwill 2001, post-exercise hypotension review — PEH after submaximal dynamic exercise persists for hours (up to ~13 h).
- Williams & Thompson 2013, ATVB (n≈49,000) — running cut incident hypertension 4.2% and walking 7.2% per MET-h/day; comparable at equal energy.
- Walking intervention 2018 (PMC6119598) — 6-month guided walking lowered SBP up to −21.3 mmHg in those with baseline SBP >160.
- Hong et al. 2018 (Korean postmenopausal stage-2 HTN) — 12-wk stair-climbing reduced arterial stiffness and BP; stiffness drop partly explained SBP improvement.
- Tulane Mediterranean cohort — climbing >5 flights/day associated with ~20% lower ASCVD risk.
편차 모델 — 워치(급성 생리)
E0를 고정하고 편차 r = 실측 − E0만 모델한다(잘 보정된 수준·위상을 다시 흔들지 않기 위해 residual mode). 입력은 워치 8개(급성 생리)뿐 — 과거 BP추정변수(전날·과거일 동시각·과거일 평균)는 제외했다. 이유: 그 lag들은 이미 E0(수준+위상)가 담고 있는 사람 level과 대체로 중복이라, 빼도 성능이 거의 유지되면서 구조가 훨씬 깔끔해진다(자기 추정치에 되먹임하지 않음).
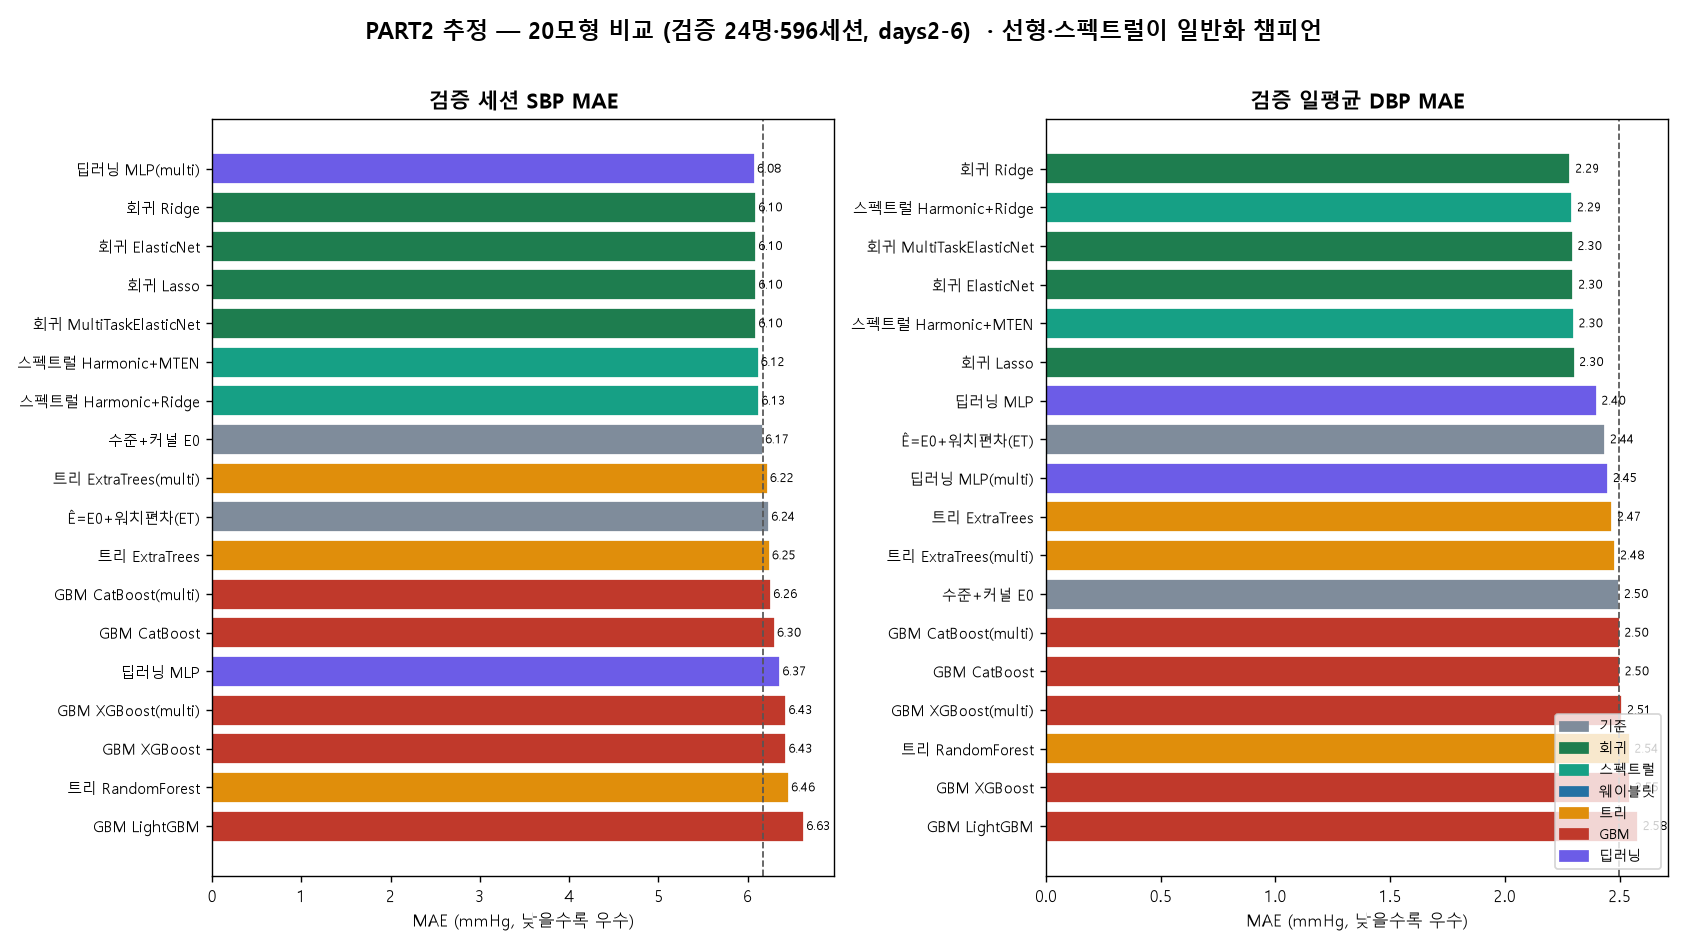
전 모형 zoo — 20개, train/valid/test
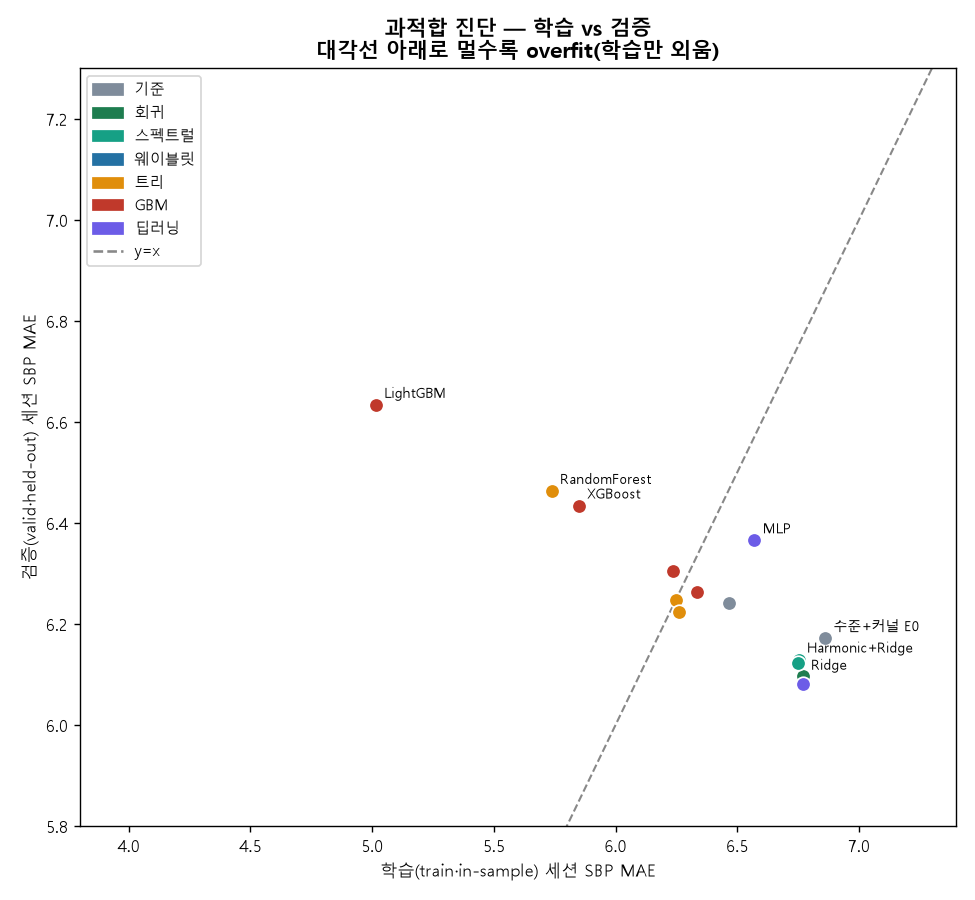
같은 편차 과제(워치변수만)에 회귀·스펙트럴·웨이블릿·트리·GBM·딥러닝을 single·multi로 올렸다(최종=E0+r̂). 셀 = MAE + BHS등급. days2-7, 검증·테스트 각 24명.
| 모형 | 검증 valid (716세션) | 테스트 test (697세션) | ||||||
|---|---|---|---|---|---|---|---|---|
| 세SBP | 세DBP | 일SBP | 일DBP | 세SBP | 세DBP | 일SBP | 일DBP | |
| 수준+커널 E0 | 6.17C | 5.12B | 3.66A | 2.50A | 5.89B | 4.83B | 2.41A | 2.35A |
| Ê=E0+워치편차(ET) | 6.24C | 5.12B | 3.76A | 2.44A | 5.82C | 4.76A | 2.50A | 2.31A |
| 회귀 Ridge | 6.10C | 5.01B | 3.59A | 2.29A | 5.77B | 4.76B | 2.40A | 2.28A |
| 회귀 Lasso | 6.10C | 5.01B | 3.58A | 2.30A | 5.79B | 4.75A | 2.43A | 2.27A |
| 회귀 ElasticNet | 6.10C | 5.01B | 3.58A | 2.30A | 5.78B | 4.75B | 2.42A | 2.28A |
| 회귀 MultiTaskElasticNet | 6.10C | 5.01B | 3.58A | 2.30A | 5.78B | 4.75B | 2.42A | 2.28A |
| 스펙트럴 Harmonic+Ridge | 6.13C | 5.03B | 3.60A | 2.29A | 5.76B | 4.68A | 2.38A | 2.29A |
| 스펙트럴 Harmonic+MTEN | 6.12C | 5.02B | 3.60A | 2.30A | 5.77B | 4.69A | 2.40A | 2.28A |
| 트리 RandomForest | 6.46C | 5.24B | 3.95A | 2.54A | 5.90C | 4.82A | 2.36A | 2.38A |
| 트리 ExtraTrees | 6.25C | 5.15B | 3.78A | 2.47A | 5.83B | 4.76A | 2.46A | 2.33A |
| 트리 ExtraTrees(multi) | 6.22C | 5.17B | 3.75A | 2.48A | 5.83B | 4.75A | 2.51A | 2.30A |
| GBM XGBoost | 6.43C | 5.23B | 3.93A | 2.55A | 5.99C | 4.76A | 2.39A | 2.29A |
| GBM LightGBM | 6.63C | 5.30B | 4.05A | 2.58A | 6.10C | 4.87A | 2.24A | 2.33A |
| GBM CatBoost | 6.30C | 5.16B | 3.82A | 2.50A | 5.79B | 4.70A | 2.31A | 2.22A |
| GBM XGBoost(multi) | 6.43C | 5.20B | 3.91A | 2.51A | 5.91C | 4.78A | 2.35A | 2.20A |
| GBM CatBoost(multi) | 6.26C | 5.13B | 3.77A | 2.50A | 5.76B | 4.68B | 2.29A | 2.19A |
| 딥러닝 MLP | 6.37C | 5.06B | 3.83A | 2.40A | 5.84B | 4.71A | 2.64A | 2.29A |
| 딥러닝 MLP(multi) | 6.08C | 5.04B | 3.60A | 2.45A | 5.81C | 4.86B | 2.49A | 2.39A |
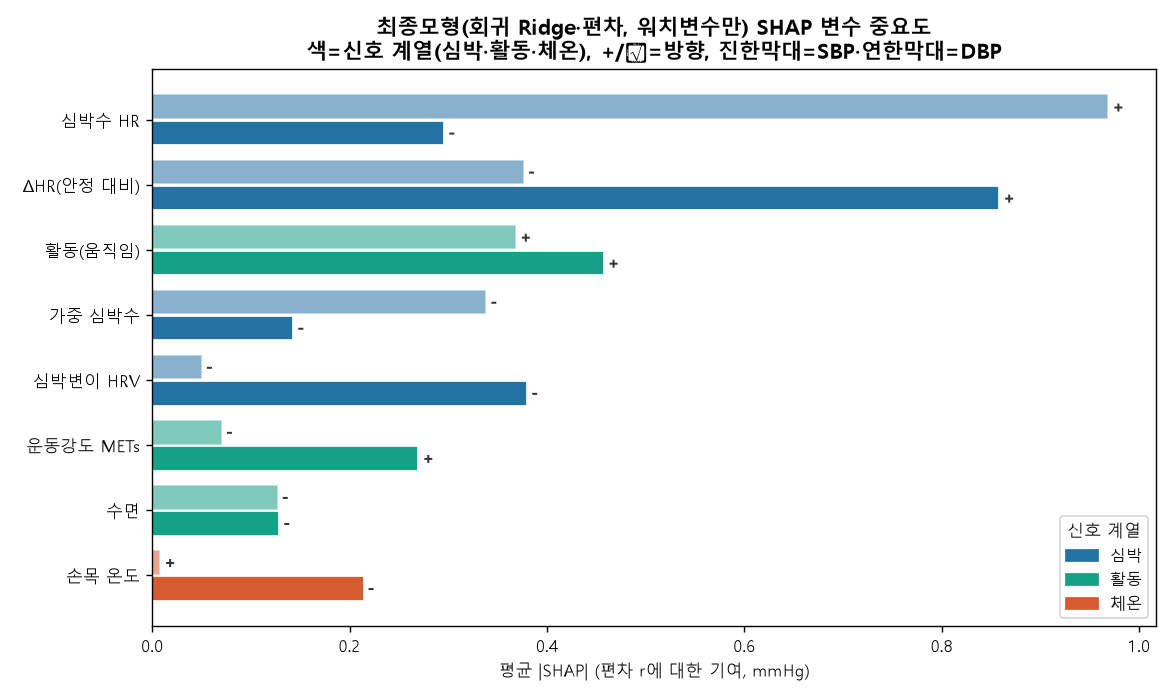
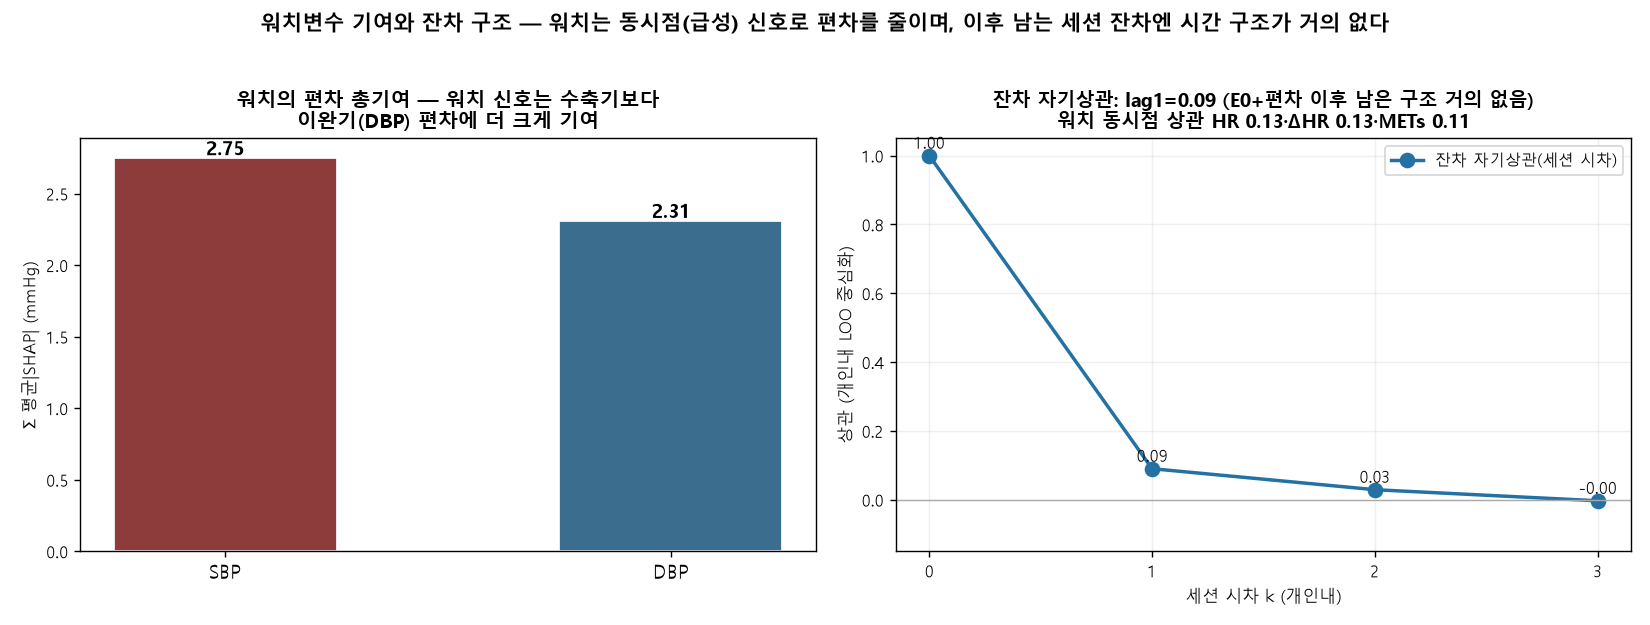
최종모형 해석 — SHAP + 설명변수 시차
챔피언 회귀 Ridge(편차 모델, 워치변수만)가 무엇을 보고 예측하는지 SHAP으로, 남은 잔차의 구조를 함께 분석했다.
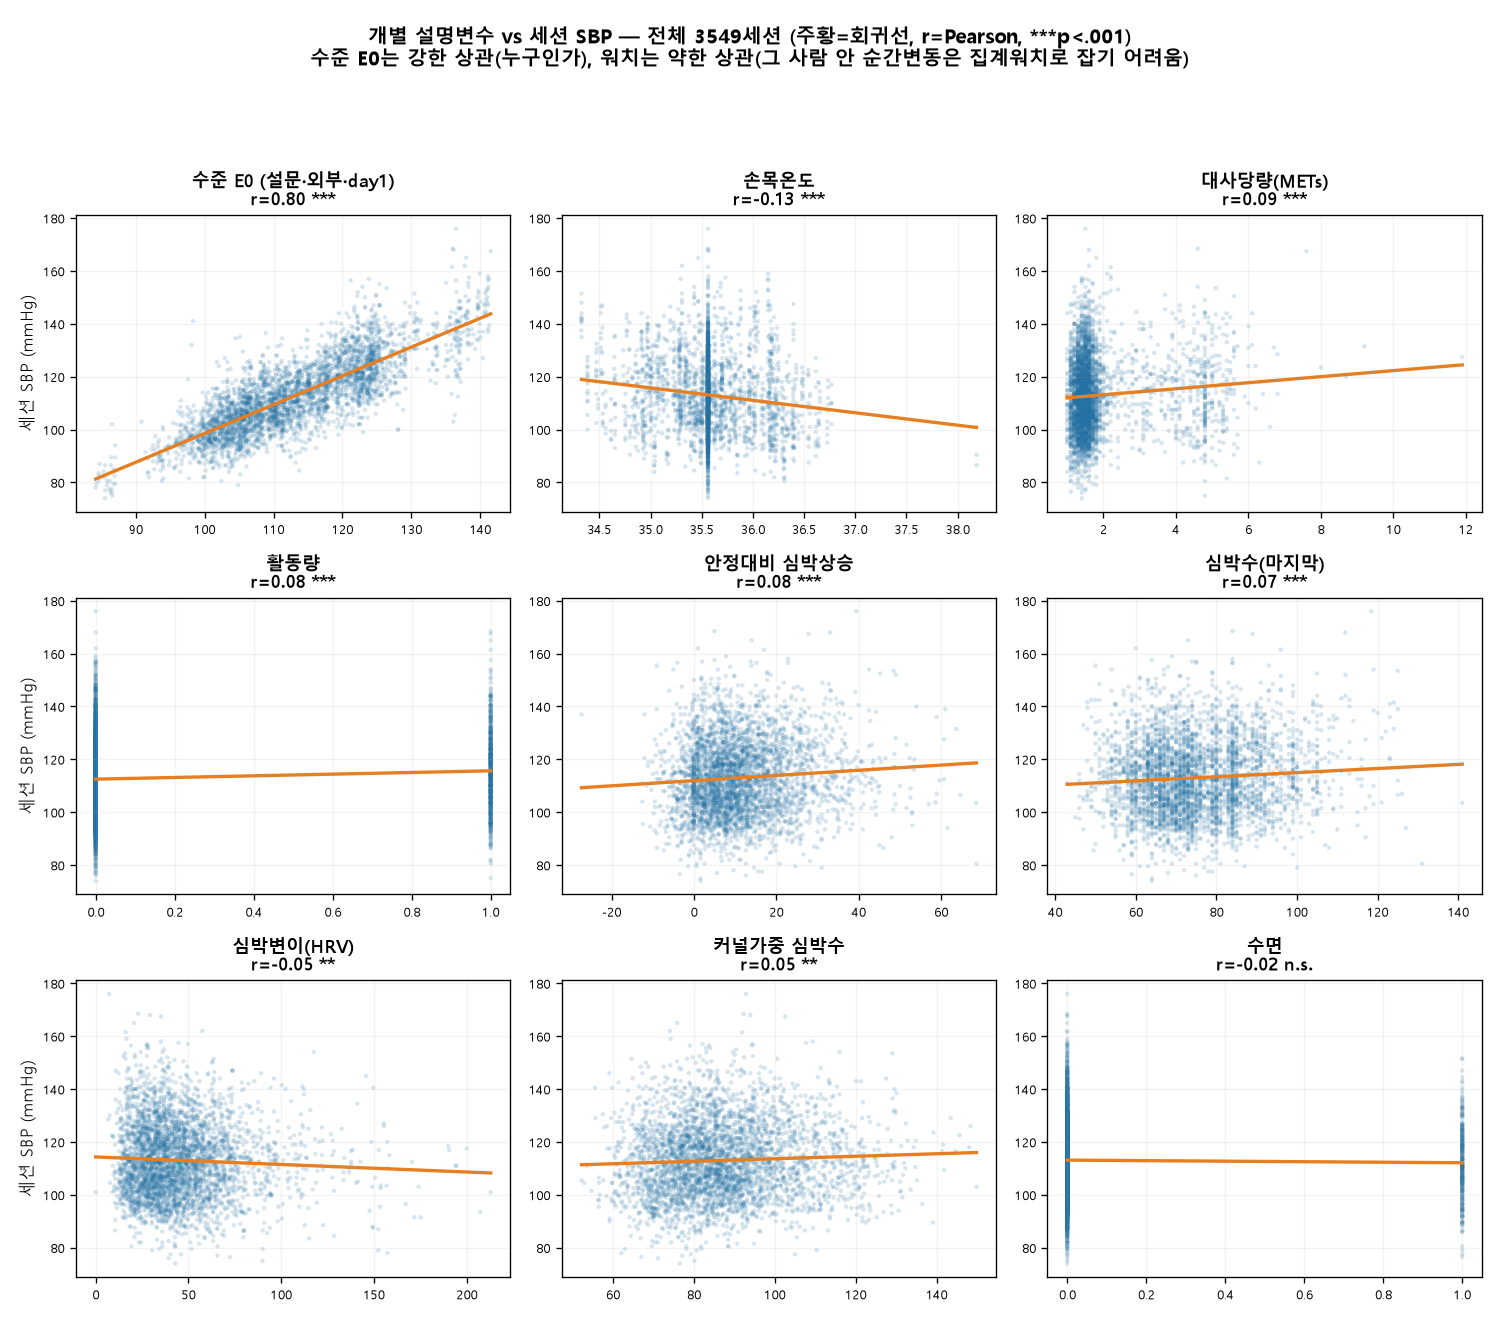
설명변수 ↔ 타깃 산점도 — 무엇이 혈압과 함께 움직이나
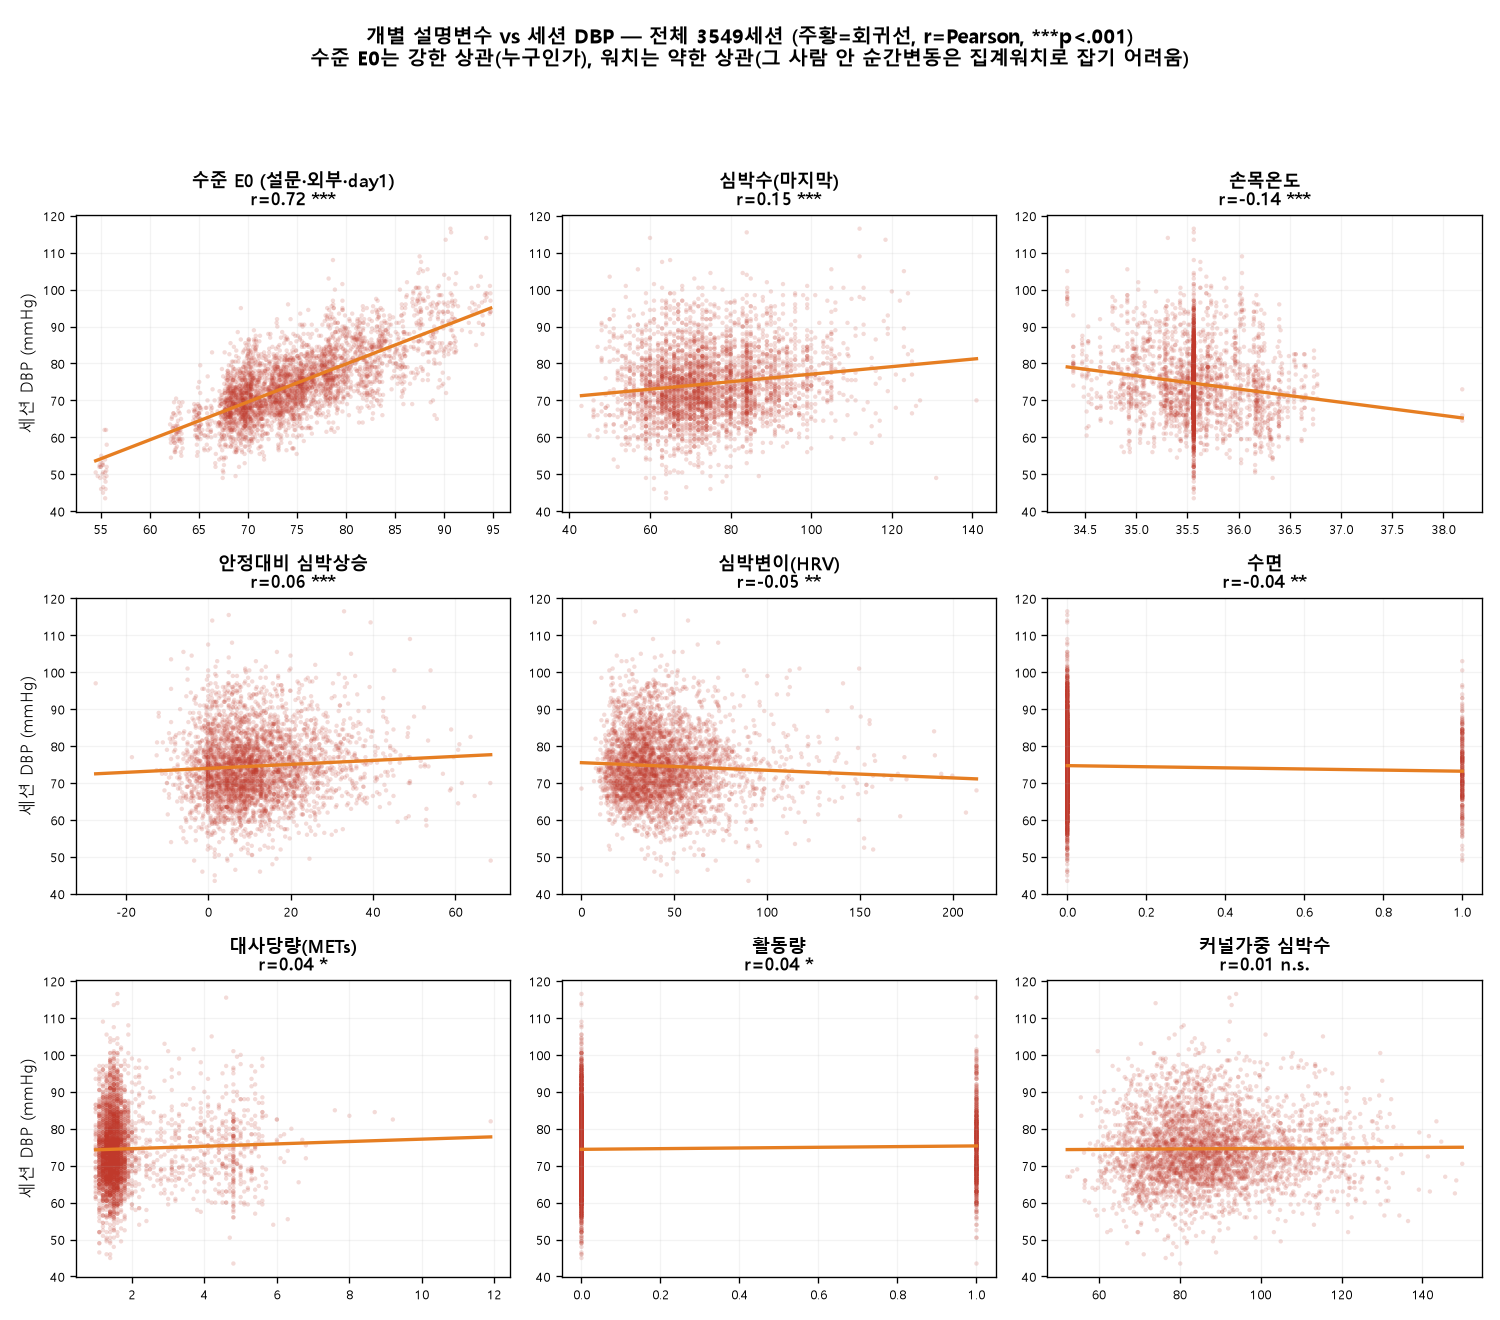
개별 설명변수(수준 E0 + 워치 8종)와 세션 혈압의 관계를 전체 3,549세션 산점도로 본다. 주황=OLS 회귀선, r=Pearson 상관, ***p<.001.
설명변수 생성 방법 — 원천 → 파생식 (어떻게 만들었나)
산점도의 9개 변수를 각각 이렇게 만들었다. 원신호 점검·생리 기전·선행연구 레퍼런스 상세는 §2-5, 수준 E0 상세는 §2-1~2-4.
| 설명변수 | 원천 | 생성 방법 (파생식) |
|---|---|---|
| 수준 E0 | day1 실측 + KNHANES 외부앵커 L + 군집(연령×성별) 일주기 | E0 = lvl + α·(day1 편차의 역시간×위상 커널가중) + (1−α)·군집 위상곡선. lvl = (n·day1평균 + 2·L)/(n+2), α = Σw/(Σw+5) |
| 심박수 HR | last_심박수 | 세션의 마지막 심박수 값 |
| 커널가중 심박 kwHR | kw_심박수 | 그 시점 주변 심박을 시간커널로 가중평균(순간 튐 완화) |
| 안정대비 심박상승 dHR | HR · 개인 HR 분포 | HR − 안정심박(개인 HR 하위 10% 분위) |
| 심박변이 HRV | last_심박 변이 | 세션 마지막 HRV (자율신경 상태) |
| 손목온도 WT | last_손목 온도 | 세션 마지막 손목 피부온도 (말초저항 대리) |
| 대사당량 METs | last_절대적 운동 강도 | 세션 마지막 METs (절대 운동강도) |
| 활동 active | METs · last_걸음 | METs≥3 또는 걸음≥300 → 1 |
| 수면 sleep | 시각 tod · active | 야간(06시 이전 또는 22시 이후) & 비활동 → 1 |
| 설명변수 | SBP r | DBP r | 방향 · 해석 |
|---|---|---|---|
| 수준 E0 (설문·외부·day1) | +0.81 | +0.72 | 강한 직선 — "누구인가(수준)" |
| 손목온도 WT | −0.13 | −0.14 | 온도↑ → BP↓ (혈관확장) |
| 심박수 HR | +0.07 | +0.15 | 심박↑ → BP↑ |
| 안정대비 심박상승 dHR | +0.08 | +0.06 | 운동부하↑ → BP↑ |
| 대사당량 METs | +0.09 | +0.04 | 활동↑ → BP↑ |
| 활동량 active (0/1) | +0.09 | +0.04 | 활동중 → BP↑ |
| 심박변이 HRV | −0.05 | −0.05 | HRV↑ → BP↓ |
| 커널가중 심박 kwHR | +0.05 | +0.01 | 약함 |
| 수면 sleep (0/1) | −0.02 | −0.04 | 매우 약함 |
환자간 vs 환자내 — 오차는 어디서 오나
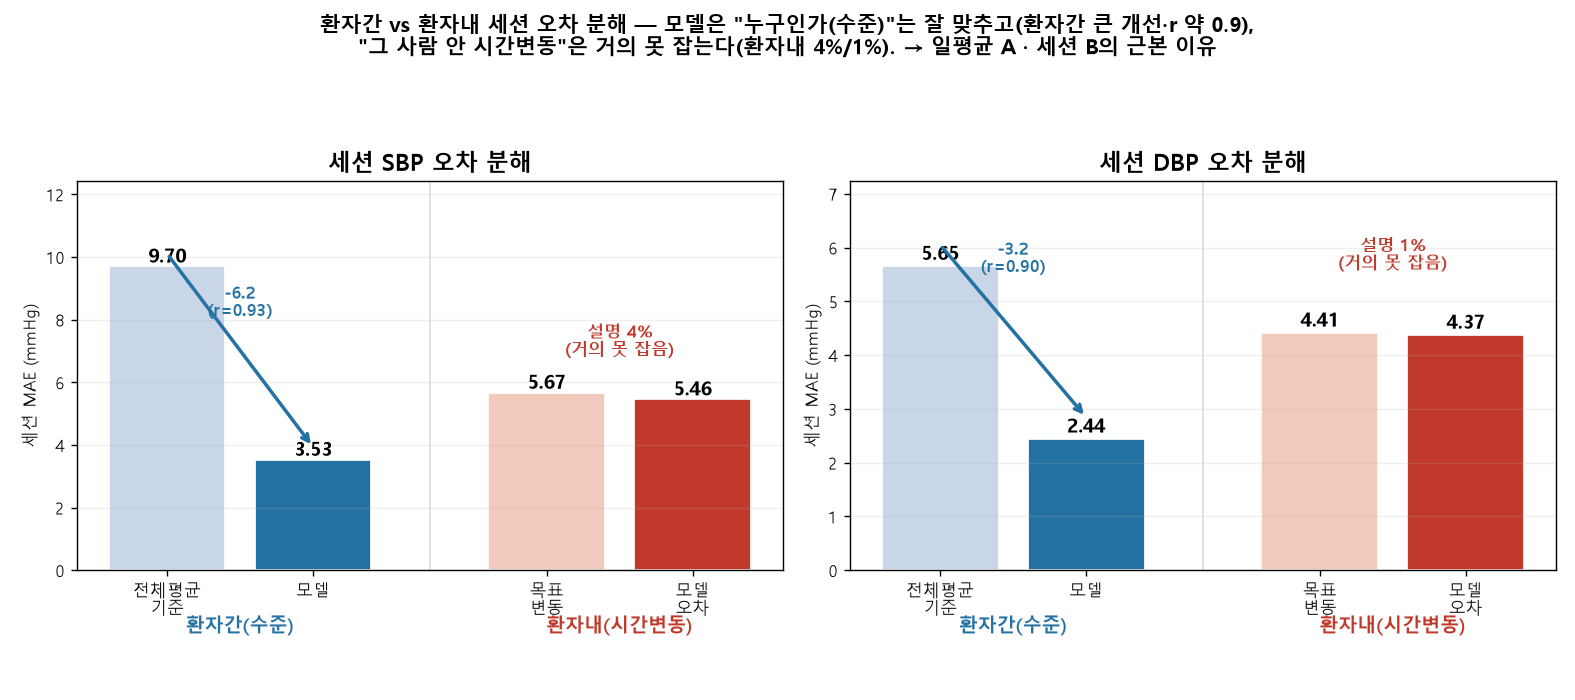
세션 오차를 두 축으로 분해했다 — 환자간(사람들 사이 = 그 사람 평소 수준을 맞추나)과 환자내(한 사람 안 = 그날그날 시간 변동을 맞추나). 개인 out-of-fold 챔피언 기준.
| 구분 | 세션 SBP | 세션 DBP |
|---|---|---|
| 전체 세션 MAE | 6.45 | 5.11 |
| 환자간(수준): 전체평균 → 모델 | 9.70 → 3.53 | 5.65 → 2.44 |
| 환자간 순위상관 r | 0.93 | 0.90 |
| 환자내(변동): 목표 → 모델오차 | 5.67 → 5.46 | 4.41 → 4.37 |
| 환자내 설명 비율 | 4% | 1% |
과적합 — 단순 모형이 일반화한다
결론 — 그리고 분단위 곡선
120명 · 세션평균 하이브리드 보간 · 사람 60:20:20 · days2-7 전부 추정(예측구간 미분리) · 수준(KNHANES+설문+day1)+위상+편차(워치만) · 전 모형 single·multi · MAE+BHS · 세션·일평균