Interpolation and Estimation of Daily-Life Blood Pressure from Surveys and Wearables: A Level–Phase–Deviation Decomposition and Its Accuracy Limits
Background. Cuffless approaches that estimate blood pressure (BP) from smartwatches and questionnaires are proliferating, yet the accuracy limits of session-level (momentary) BP and their underlying causes remain insufficiently characterized.
Methods. Reference BP was measured about five times per day for seven days in 120 participants, with wearable signals and survey variables. After session-averaging and outlier removal, each day was causally interpolated to a minute-level hybrid series in which measured times retain observed values. A person-level mean was anchored by an external cohort (KNHANES), survey variables, and a single-day calibration; a circadian phase kernel formed a structural estimate E0 = level + phase. The deviation r = observed − E0 was modeled from wearable signals only (prior BP-estimate features were excluded), comparing single- and multi-task model families. No held-out forecast day was set aside: days 2–7 were all used for estimation (day 1 served only as a calibration anchor). Participants were split 60:20:20; performance was evaluated only at measured time points using mean absolute error (MAE) and British Hypertension Society (BHS) grade.
Results. Linear (ridge regression) and spectral models generalized best, reaching held-out (test, 24 people) daily-average MAE of 2.40 mmHg (systolic) and 2.28 mmHg (diastolic), both BHS Grade A, and session-level MAE of 5.77 mmHg systolic (Grade B) and 4.76 mmHg diastolic (Grade B; 4.68, Grade A, with harmonic+ridge); tree and gradient-boosting models overfit. Excluding the prior BP-estimate features barely changed accuracy, because E0 (level + phase) already carries the person's level. By SHAP, the wearable contribution was led by ΔHR and heart rate (cardiovascular arousal) and was larger for diastolic BP.
Conclusions. With aggregated wearable signals, one-day calibration, and the structural estimate E0, daily averages reach Grade A but session-level systolic BP is capped at Grade B — a structural signature of mean-regression toward each person's set-point, an averaged phase, and near-zero residual autocorrelation. The literature consistently indicates that raw PPG waveform morphology, pulse transit time, and periodic recalibration are required to reach session Grade A.
1. Introduction
Blood pressure (BP) is among the most informative and modifiable predictors of cardiovascular morbidity and mortality, and its clinical value depends heavily on when and how often it is measured. A single clinic reading captures only one moment along a continuously varying trajectory, whereas ambulatory and out-of-office monitoring reveal day-to-day and within-day patterns that carry independent prognostic weight. Conventional ambulatory monitoring, however, relies on intermittent cuff inflations that disturb sleep and daily activity, which constrains both adherence and the temporal density of the resulting record.
Cuffless wearable devices have therefore attracted growing interest as a means of acquiring frequent, low-burden BP information during ordinary life. Smartwatches that combine physiological sensing with lightweight self-report offer a particularly attractive substrate, because optical and motion signals can be paired with contextual survey responses to characterise an individual's state at each measurement occasion. This combination of continuous wearable signals and periodic survey input has emerged as a practical trend for everyday BP assessment outside the clinic.
Despite this momentum, several gaps remain. Most prior work has framed the problem as instantaneous estimation, mapping signals at a single moment to a concurrent BP value. Two tasks that are equally relevant to real-world deployment are rarely treated within one framework: dense interpolation of the BP trajectory between sparse cuff measurements, and minute-level estimation (nowcasting) of BP at target times that lie away from the calibration anchor. In addition, the accuracy attainable at the level of an individual measurement session, as opposed to coarser daily summaries, has remained poorly characterised, leaving the practical limits of aggregate-feature wearables uncertain.
To address these gaps, the present study, DAY BP, develops a unified framework around a level–phase–deviation decomposition. The level term captures each person's stable BP set-point, anchored by a short calibration period and an external population reference. The phase term captures the structured circadian variation shared within demographic clusters; in the estimation task it is built from the calibration-day points blended with a population age×sex cluster circadian curve, so that for target times far from calibration the population shape dominates. The deviation term captures the remaining residual fluctuation that current wearable signals can explain, modelled from the watch signals alone on the structural residual r = observed − E0. Because the structural estimate E0 = level + phase already carries each person's level, autoregressive lags of prior BP estimates were found to be largely redundant and were removed, keeping the model free of feedback on its own estimates. By separating these three components, the same structural backbone supports interpolation between measurements and estimation at unmeasured times, while performance is reported at both the session and daily-average levels.
The dataset underlying this work comprised 120 participants (60 male and 60 female; mean age 32.1 years, standard deviation (SD) 8.1, range 18–66; mean body mass index 22.7) monitored over 7 days at approximately five sessions per day, yielding roughly 4,128 sessions after session-averaging of 8,193 raw readings. Reference systolic BP (SBP) averaged 113.0 mmHg (SD 14.1) and diastolic BP (DBP) 74.5 mmHg (SD 9.5), with intraclass correlation coefficients of 0.72 (SBP) and 0.63 (DBP) indicating that between-person variation dominated. Data were partitioned strictly at the person level in a 60:20:20 ratio (72, 24, and 24 participants), so that no individual contributed to more than one split. Within each participant's record, day 1 served solely as a calibration anchor for the personal level and was not used as a training or evaluation target, while days 2–7 supplied the sessions used for estimation training, validation, and testing; performance was computed only at measured time points.
This study makes three contributions. First, it unifies dense within-day interpolation and minute-level estimation for previously unseen individuals under a single level–phase–deviation decomposition, anchoring the level term with an external population reference that significantly improved cross-person SBP accuracy. Second, it systematically benchmarks single- and multi-task model families for the watch-only deviation term, showing that linear and spectral models generalised best out-of-sample while tree and gradient-boosting methods overfit under the modest training size. Third, it quantifies the accuracy limit of aggregate-feature wearables and its causes, demonstrating that daily averages reached the British Hypertension Society (BHS) Grade A while session-level SBP remained near Grade B owing to regression toward each person's set-point, an averaged circadian phase, and near-zero residual autocorrelation, and relating this limit to the waveform, timing, and recalibration requirements identified in the literature.
The remainder of the paper proceeds as follows: Section 2 describes the cohort, measurement protocol, and study design; Section 3 details the interpolation, level, phase, and deviation components; Section 4 reports estimation results against established standards; and Section 5 discusses the accuracy limit, its causes, and directions for clinically ready cuffless monitoring.
2. Related work
Cuffless blood pressure (BP) estimation from photoplethysmography (PPG) has been pursued along two broadly distinct feature paradigms. Waveform-based approaches extract morphological descriptors from the raw PPG pulse, including systolic and diastolic peak geometry, the dicrotic notch, the augmentation index, the reflection index, and second-derivative features of the photoplethysmogram (SDPTG). Aggregate-feature approaches instead summarize physiology over a window into scalar descriptors such as heart rate, heart rate variability, and activity intensity. The two paradigms differ sharply in the granularity of information they retain: morphological descriptors encode the beat-to-beat contour shaped by arterial compliance and wave reflection, whereas aggregate descriptors discard pulse shape and retain only the slow envelope of cardiovascular state. This distinction has direct consequences for attainable accuracy, because the British Hypertension Society (BHS) Grade A threshold for individual readings (60, 85, and 95 percent of absolute errors within 5, 10, and 15 mmHg) is demanding at the single-reading level.
A second informative timing channel is derived from pulse transit time (PTT) and pulse arrival time (PAT), typically requiring a second synchronized signal such as the electrocardiogram. The timing channel carries a stronger systolic signal than morphology alone: reported systolic BP (SBP) root-mean-square error is approximately 5.3 mmHg for PTT-based estimation versus approximately 9.8 mmHg for PAT-based estimation, the latter being degraded by the variable pre-ejection period. Among waveform-driven deep models, PPG2BP-Net, which operates on the raw pulse, has reached an SBP error of 0.21 plus or minus 7.51 mmHg, satisfying Grade A. These results establish that single-reading Grade A performance has, in the literature, depended on access to raw morphology, an explicit timing channel, or both, rather than on aggregate descriptors.
2.1 Calibration, drift, and the limits of aggregate features
A recurring constraint is calibration. Calibration-free deployment degrades accuracy markedly, and validated smartwatch devices have been shown to regress toward the calibration set-point, over-estimating low pressures and under-estimating high pressures; on these grounds such devices have been judged not clinically ready. Even with calibration, accuracy decays over time as physiology drifts, with reported drift on the order of 0.022 mmHg per day, motivating periodic recalibration on at most a monthly cadence. The collective finding from this body of work is that aggregate wearable features combined with sparse calibration regress predictions toward each person's individual set-point, a mean-regression effect that caps single-reading SBP accuracy near the Grade B regime rather than Grade A.
2.2 Wearable physiology and autonomic state
The value of aggregate features rests on a physiological premise: heart rate, weighted heart rate, the deviation of heart rate from resting, heart rate variability, wrist temperature, activity and sleep status, and metabolic equivalents (METs) jointly encode the autonomic state that modulates BP around an individual's structural level. These signals capture the acute, session-level autonomic excursions that accompany activity, rest, and sleep, even though they do not recover pulse morphology. This premise is consistent with the observation that aggregate features are well suited to tracking person-level and daily averages while remaining limited at the level of individual sessions, where within-person variability is dominated by transient excursions and measurement noise.
2.3 Home-BP variability and estimation baselines
Day-to-day home BP exhibits genuine physiological variability, and characterizing this variability is important both clinically and as a reference point for what a minute-level estimator must improve upon. Because a large share of the total variance lies between persons rather than within persons across days, a person's own recent mean is a strong baseline against which the informational gain of wearable-based estimation should be judged. Reporting this within-person variability alongside naive person-level baselines therefore provides a meaningful yardstick for contemporaneous estimation: an estimator that merely recovers each person's set-point captures the between-person structure but adds little at the individual-session level, where the residual variability is dominated by transient autonomic excursions and reference-measurement noise. Framing home-BP variability as an estimation baseline, rather than as a target for future-value prediction, clarifies that the operative question is how much of the within-person, within-day fluctuation aggregate wearable signals can actually resolve.
2.4 The unfilled gap
Taken together, prior work has shown that single-reading Grade A accuracy is achievable primarily through raw PPG morphology or a dedicated PTT timing channel, that calibration-free use and temporal drift degrade aggregate-feature devices toward their calibration set-point, and that aggregate wearable features nonetheless encode the autonomic state governing BP around a person's structural level. What remains unaddressed is a unified treatment, under recognized standards (BHS, AAMI/ISO 81060-2, and IEEE 1708), of how far aggregate smartwatch signals and survey data, with only single-day calibration and no actual past BP beyond that day, can be pushed for minute-level, session- and daily-level estimation, including an explicit account of where the aggregate-feature ceiling lies and why daily-average accuracy can reach Grade A while single-session accuracy cannot. The present study addresses this gap.
3. Methods
3.1 Cohort, data, and measurement noise
The DAY BP study enrolled 120 adults (60 male, 60 female) who were monitored continuously for seven consecutive days. The mean age was 32.1 years (standard deviation [SD] 8.1, range 18–66) and the mean body mass index (BMI) was 22.7 kg/m2; 10 participants self-reported a prior diagnosis of hypertension. Each participant contributed approximately five blood pressure (BP) sessions per day, yielding roughly 4,128 sessions across the cohort. Reference cuff measurements averaged 113.0 mmHg systolic (SBP; SD 14.1) and 74.5 mmHg diastolic (DBP; SD 9.5). The intraclass correlation coefficient (ICC) was 0.72 for SBP and 0.63 for DBP, indicating that between-person differences dominated the total BP variance and that the principal modeling target was each individual's relatively stable set-point together with its smaller within-day excursions.
At every session the protocol acquired two cuff readings one minute apart, which were then averaged to form a single session value; the session timestamp was set to the last reading. This design directly addressed two well-documented sources of error in oscillometric BP. First, a single reading carries substantial measurement noise, with an estimated single-reading noise SD of approximately 4.8 mmHg for SBP and 3.8 mmHg for DBP; averaging two independent readings reduces the standard error of the session estimate by a factor of the square root of two. Second, the first reading of a session is inflated by an alerting (white-coat) response, here estimated at +2.1 mmHg; averaging the first and second readings attenuates this transient bias rather than propagating it into the modeling target. The 8,193 raw readings were thereby session-averaged to 4,169 session values. The practical importance of this step is quantified by decomposing within-person variance: after session-averaging, the within-person SD was 7.19 mmHg for SBP and 5.54 mmHg for DBP, yet an estimated 18–36% of the within-person SBP variance was attributable to measurement noise rather than to physiological signal. Treating individual readings as ground truth would therefore have asked the models to fit a substantial fraction of irreducible noise.
Cleaning removed physiologically impossible values (SBP below 70 mmHg or above 220 mmHg); two artifacts were removed on this basis. Cohort partitioning was performed strictly at the person level in a 60:20:20 ratio (72 training, 24 validation, and 24 test participants), so that no individual contributed sessions to more than one split. Within each participant's record, day 1 served solely as a calibration anchor: its readings were used only to anchor the personal BP level and were not treated as a training or evaluation target. Days 2–7 were all used for minute-level estimation, with the person-level 60:20:20 split governing which participants' days 2–7 sessions entered the training, validation, and test partitions. No forecast day was held out; every day beyond the day-1 anchor contributed to estimation train, validation, or test according to the participant's split assignment.
3.2 Hybrid interpolation
Because wearable signals and survey items were available at minute resolution while cuff references were sparse, each day's BP trajectory was reconstructed by a minute-level hybrid interpolation that combined a cluster circadian curve with the day's own observed sessions. The interpolation was strictly causal within each day: a given minute was reconstructed only from measurements available up to that point, so that no future BP value leaked into the representation of an earlier minute. Each observed session contributed to a reconstructed minute through a recency-by-phase kernel,
w = exp(−|Δt| / τ) · exp(−circ(φ)2 / (2·ℓ2)),
where the first factor weights observations by temporal recency with a time constant τ of 1,440 minutes, and the second factor weights them by similarity in circadian phase. In this interpolation pass the phase rides the person's own dense same-day measurements, using a length scale ℓ = 90 minutes with a mixing weight κ = 0.5; this differs from the estimation phase kernel (Section 3.4), which borrows an averaged population circadian shape. The term circ(φ) denotes the circular time-of-day distance computed on a 1,440-minute ring, so that minutes near midnight and minutes near the end of the day were treated as adjacent rather than maximally distant; this preserved the diurnal continuity of the BP rhythm across the day boundary.
Measured minutes were anchored to their observed values and flagged with an is_actual indicator, so that the kernel-weighted reconstruction filled only the unmeasured minutes and never overwrote a genuine cuff measurement. This anchoring was verified by a sanity check confirming a reconstruction error of 0.00 at measured minutes. Critically, the interpolated trajectory was used only as features and as intermediate targets for downstream estimation; it was never treated as evaluation ground truth. All reported performance was computed exclusively at measured time points (Table 1), ensuring that every error figure was assessed against an independent cuff reference rather than against a quantity the pipeline had itself imputed.
3.3 Level model
The level model estimated each person's blood pressure set-point, the dominant source of variance given the high between-person intraclass correlation coefficients (ICC; systolic blood pressure [SBP] 0.72, diastolic blood pressure [DBP] 0.63). Rather than relying on the day1 calibration mean alone, which is sparse and noisy, the person mean L was formed by empirical-Bayes shrinkage of the day1 calibration toward an external population-fitted level. Specifically, L = (n cm + 2 Lext) / (n + 2), where cm denoted the day1 calibration mean, n the day1 reading count, and Lext the externally anchored level. The prior was weighted as two pseudo-observations, so that subjects with denser day1 sampling relied more heavily on their own calibration while sparsely sampled subjects borrowed strength from the external anchor. Day1 thus served purely as a calibration anchor for the personal level and was not itself a training or evaluation target.
The external level Lext was obtained from the Korea National Health and Nutrition Examination Survey (KNHANES) HN24 cohort (6,997 respondents; 6,033 adults; 5,957 with blood pressure available) using weighted ridge regression. Predictors comprised age and body mass index (BMI) splines, a sex interaction, physician-diagnosed hypertension, antihypertensive medication, smoking, and drinking, mirroring the self-reported survey features collected in the present study. Because the smartwatch reference differed systematically from the cuff-based survey instrument, a device offset alpha was fit on the training cohort (SBP +1.9 mmHg, DBP +2.7 mmHg) and added to the anchor.
External-anchor validation over 20 held-out splits confirmed the benefit of population representativeness (Table 1). For SBP, the KNHANES anchor achieved a mean absolute error (MAE) of 6.61 ± 0.78 mmHg, significantly better than a cohort-cluster anchor at 7.17 ± 1.04 mmHg (paired p = 0.001) and far better than a naive population mean at 10.05 mmHg. For DBP, the anchor reached 4.84 ± 0.59 mmHg, statistically equivalent to the cohort-cluster baseline at 4.94 mmHg (p = 0.41) and superior to the population mean at 5.69 mmHg. Population representativeness mattered because a small convenience cohort (N = 120, mean age 32.1 years, SD 8.1) under-sampled the older and hypertensive tail of the distribution; a nationally weighted survey supplied a calibrated prior across the full age, BMI, and risk-factor range, reducing shrinkage bias for atypical individuals.
3.4 Phase kernel
On top of the person level, a circadian phase component captured the systematic within-day shape of blood pressure. The structural estimate combined the two components additively, E0 = level + phase, yielding a smooth, fully causal baseline that depended only on the day1 calibration and external population information. Crucially, the phase term was constructed differently in interpolation (Part 1) than in estimation, and this difference is a direct source of the session-level accuracy ceiling.
In interpolation, the phase rode each person's own dense, same-day measurements: the recency-by-phase kernel operated on a comparatively short circadian length-scale (ℓ = 90 minutes) with a low mixing weight toward the population curve (κ = 0.5), so that a given day's specific excursions were tracked from that day's own observations. In estimation, by contrast, the person's own dense measurements are not available at the target time. The phase was therefore built from the day1 calibration points, weighted by a recency-by-phase kernel with a broader length-scale (ℓ = 196 minutes) and a stronger prior confidence (κ = 5), and blended with the population age×sex cluster circadian curve estimated from four demographic strata on a 1,440-minute ring. For target times close to the day1 calibration the person-specific points retained appreciable weight, whereas for target times far from day1 the recency term decayed and the population cluster curve dominated.
Because estimation therefore borrows an average circadian shape rather than the person's own same-day rhythm, it cannot capture the specific excursions of any individual day. This reliance on a population-average phase is one of the principal reasons that session-level blood pressure is capped at BHS Grade B, even though the same E0 backbone yields Grade A daily averages.
3.5 Deviation models
With the structural estimate E0 held fixed, the residual r = observed − E0 captured the remaining short-term variation, and the final prediction was reconstructed as E0 + r̂. Fixing E0 isolated the deviation modeling problem to the explainable, time-varying signal and prevented the residual learner from re-fitting the person set-point. The deviation model consumed watch signals only: heart rate, weighted heart rate, the change in heart rate relative to resting, heart-rate variability, wrist temperature, an active flag, a sleep flag, and metabolic equivalents (METs). These aggregate wearable descriptors encode the acute autonomic and activity state that modulates blood pressure around the structural level.
No prior-blood-pressure-estimate features were used. An earlier formulation had included a group of autoregressive lags derived from prior estimates (the past daily-mean, the previous-day same-time value, and the past same-time mean), but these were removed. Because the structural estimate E0 = level + phase already carries the person's blood pressure level, those lags were largely redundant with E0; removing them keeps the model clean, avoids any feedback of the model on its own estimates, and leaves accuracy essentially unchanged. No actual past blood pressure entered the model beyond the day1 calibration, so the pipeline remained deployable without ongoing cuff measurement.
To characterize the residual signal without prematurely committing to one inductive bias, 20 model families were compared in single- and multi-task forms, each applied in residual mode on r. These spanned regression (ridge, lasso, elastic-net, multi-task elastic-net), spectral methods (harmonic features with ridge or multi-task elastic-net), wavelet methods (continuous Ricker multiresolution with ridge or multi-task elastic-net), tree ensembles (random forest, extra-trees, multi-task extra-trees), gradient boosting (XGBoost, LightGBM, CatBoost, and multi-task XGBoost and CatBoost variants), and deep models (multilayer perceptron [MLP] and multi-task MLP). This breadth was deliberate: it spanned the bias-variance spectrum from strongly regularized linear models to flexible nonlinear learners, and contrasted single-task fitting against multi-task formulations that share representation across SBP and DBP. Comparing this range was necessary because expressive tree and boosting models attained the lowest in-sample error but generalized poorly under the modest training size (LightGBM, for example, fell from a training session SBP MAE of 5.02 mmHg to 6.63 mmHg on validation), whereas linear and spectral models generalized best (Figure 1-3); the comparison thus established which inductive bias the deviation signal actually supported rather than assuming it.
4. Results
4.1 Cohort and basic statistics
The DAY BP study enrolled 120 participants (60 male, 60 female) monitored for seven consecutive days at approximately five sessions per day. After cleaning of physiologically impossible values (systolic blood pressure [SBP] below 70 or above 220 mmHg; two artefacts removed), the 8,193 raw readings were session-averaged to 4,169 sessions (approximately 4,128 valid sessions). The cohort had a mean age of 32.1 years (standard deviation [SD] 8.1, range 18–66) and a mean body mass index of 22.7 kg/m², with 10 participants reporting a prior diagnosis of hypertension (Table 1). Reference blood pressure averaged 113.0 mmHg (SD 14.1) for SBP and 74.5 mmHg (SD 9.5) for diastolic blood pressure (DBP). The intraclass correlation coefficient (ICC) was 0.72 for SBP and 0.63 for DBP, indicating that between-person differences dominated the total variance. After session-averaging, the within-person SD fell to 7.19 mmHg (SBP) and 5.54 mmHg (DBP). Because the measurement protocol averaged two readings taken one minute apart, the single-reading measurement-noise SD was approximately 4.8 mmHg (SBP) and 3.8 mmHg (DBP), with a first-reading alerting bias of +2.1 mmHg; consequently, an estimated 18–36% of the within-person SBP variance was attributable to measurement noise. For the estimation analyses, day 1 served solely as the calibration anchor that fixed each person's structural level and was not used as a training or evaluation target, whereas days 2–7 were all used for estimation and were partitioned at the person level in a 60:20:20 ratio (72 training, 24 validation, and 24 test participants), so that no individual contributed sessions to more than one split. Watch-signal density was unevenly distributed across participants and time of day, reflecting heterogeneous wear behaviour.
| Item | Value |
|---|---|
| Participants (male / female) | 120 (60 / 60) |
| Age (years) | 32.1 ± 8.1 (range 18–66) |
| Body mass index (kg/m2) | 22.7 |
| Self-reported hypertension | 10 participants |
| Reference SBP / DBP (mmHg) | 113.0 ± 14.1 / 74.5 ± 9.5 |
| Intraclass correlation (SBP / DBP) | 0.72 / 0.63 |
| Within-person SD after session-averaging (SBP / DBP) | 7.19 / 5.54 mmHg |
| Single-reading measurement-noise SD (SBP / DBP) | ~4.8 / ~3.8 mmHg |
| First-reading alerting bias | +2.1 mmHg |
| Sessions (from raw readings) | 4,169 (from 8,193) |
| External KNHANES anchor, SBP MAE | 6.61 ± 0.78 (vs cohort-cluster 7.17 ± 1.04, p = 0.001; population mean 10.05) |
| External KNHANES anchor, DBP MAE | 4.84 ± 0.59 (vs 4.94, p = 0.41; population mean 5.69) |
4.2 Interpolation quality
The minute-level hybrid interpolation reconstructed each day causally from that day's own dense same-day measurements using a cluster circadian curve combined with a recency-by-phase kernel (length scale ℓ = 90 min, mixing weight κ = 0.5). Measured minutes retained their observed values under an is_actual flag, and the sanity error at measured minutes was 0.00 mmHg by construction, confirming that interpolation introduced no leakage at evaluation points. Interpolated values were used only as features and intermediate targets; all reported performance was computed exclusively at measured time points, never against interpolated ground truth.
| Model | Validation (24 people, 716 sessions) | Test (24 people, 697 sessions) | ||||||
|---|---|---|---|---|---|---|---|---|
| sSBP | sDBP | dSBP | dDBP | sSBP | sDBP | dSBP | dDBP | |
| E0 (level + phase) | 6.17C | 5.12B | 3.66A | 2.50A | 5.89B | 4.83B | 2.41A | 2.35A |
| Ridge regression | 6.10C | 5.01B | 3.59A | 2.29A | 5.77B | 4.76B | 2.40A | 2.28A |
| Lasso | 6.10C | 5.01B | 3.58A | 2.30A | 5.79B | 4.75A | 2.43A | 2.27A |
| Elastic-net | 6.10C | 5.01B | 3.58A | 2.30A | 5.78B | 4.75B | 2.42A | 2.28A |
| Multi-task elastic-net | 6.10C | 5.01B | 3.58A | 2.30A | 5.78B | 4.75B | 2.42A | 2.28A |
| Harmonic + ridge | 6.13C | 5.03B | 3.60A | 2.29A | 5.76B | 4.68A | 2.38A | 2.29A |
| Harmonic + MTEN | 6.12C | 5.02B | 3.60A | 2.30A | 5.77B | 4.69A | 2.40A | 2.28A |
| Random forest | 6.46C | 5.24B | 3.95A | 2.54A | 5.90C | 4.82A | 2.36A | 2.38A |
| Extra-trees | 6.25C | 5.15B | 3.78A | 2.47A | 5.83B | 4.76A | 2.46A | 2.33A |
| Extra-trees (multi) | 6.22C | 5.17B | 3.75A | 2.48A | 5.83B | 4.75A | 2.51A | 2.30A |
| XGBoost | 6.43C | 5.23B | 3.93A | 2.55A | 5.99C | 4.76A | 2.39A | 2.29A |
| LightGBM | 6.63C | 5.30B | 4.05A | 2.58A | 6.10C | 4.87A | 2.24A | 2.33A |
| CatBoost | 6.30C | 5.16B | 3.82A | 2.50A | 5.79B | 4.70A | 2.31A | 2.22A |
| XGBoost (multi) | 6.43C | 5.20B | 3.91A | 2.51A | 5.91C | 4.78A | 2.35A | 2.20A |
| CatBoost (multi) | 6.26C | 5.13B | 3.77A | 2.50A | 5.76B | 4.68B | 2.29A | 2.19A |
| MLP | 6.37C | 5.06B | 3.83A | 2.40A | 5.84B | 4.71A | 2.64A | 2.29A |
| MLP (multi) | 6.08C | 5.04B | 3.60A | 2.45A | 5.81C | 4.86B | 2.49A | 2.39A |
s = session level; d = daily-average level. Grade A/B/C in colour. The structural estimate E0 (level + phase) is shown as the baseline; the champion ridge regression and the equivalent harmonic-plus-ridge generalize best, whereas LightGBM/XGBoost attain the lowest in-sample error but the worst held-out error.
4.3 Estimation performance
Estimation combined the structural estimate E0 = level + phase with a learned deviation term r̂, where the residual r = observed − E0 was regressed on wearable signals only. In estimation the phase kernel was built from the day-1 calibration points (recency-by-phase weighted, length scale ℓ = 196 min, confidence κ = 5) blended with the population age × sex cluster circadian curve; for target times far from the day-1 anchor the recency weighting decays and the population curve dominates. Because this borrowed circadian shape is an average rather than the specific day's trajectory, E0 cannot capture a given day's idiosyncratic excursions, which is a key reason session-level SBP is capped at Grade B. The structural estimate alone was already strong: on the held-out test set (24 people, 697 sessions), E0 achieved daily-average mean absolute errors (MAEs) of 2.41 mmHg (British Hypertension Society [BHS] Grade A) for SBP and 2.35 mmHg (Grade A) for DBP, and session-level MAEs of 5.89 mmHg (SBP) and 4.83 mmHg (DBP).
Twenty model families were compared for the deviation component. Linear and spectral models generalized best, whereas tree ensembles and gradient-boosting methods attained the lowest in-sample errors but collapsed out of sample: LightGBM reached a training session-SBP MAE of 5.02 mmHg yet degraded to 6.63 mmHg on validation, a clear overfitting signature. On the validation set, ridge regression was the champion, achieving a session-level SBP MAE of 6.10 mmHg and daily-average MAEs of 3.59 mmHg (Grade A) for SBP and 2.29 mmHg (Grade A) for DBP. On the held-out test set, ridge regression on the watch-only deviation attained a session-level MAE of 5.77 mmHg (Grade B) for SBP and 4.76 mmHg (Grade B) for DBP, and daily-average MAEs of 2.40 mmHg (Grade A) for SBP and 2.28 mmHg (Grade A) for DBP (Table 2). The harmonic-plus-ridge spectral model was effectively equivalent and improved the session DBP marginally to 4.68 mmHg (Grade A). Adding the deviation term thus lowered the session-level error slightly relative to E0 alone while leaving daily-average accuracy essentially unchanged, both remaining at Grade A.
The deviation model used wearable signals only. The prior-BP-estimate features employed in earlier configurations (past daily mean, previous-day same-time, and past same-time estimates) were removed, because the structural estimate E0 = level + phase already carries the person's level and rendered those autoregressive lags largely redundant. Removing them kept the model clean, with no feedback on its own estimates, at essentially unchanged accuracy.
4.4 Wearable-signal attribution (SHAP)
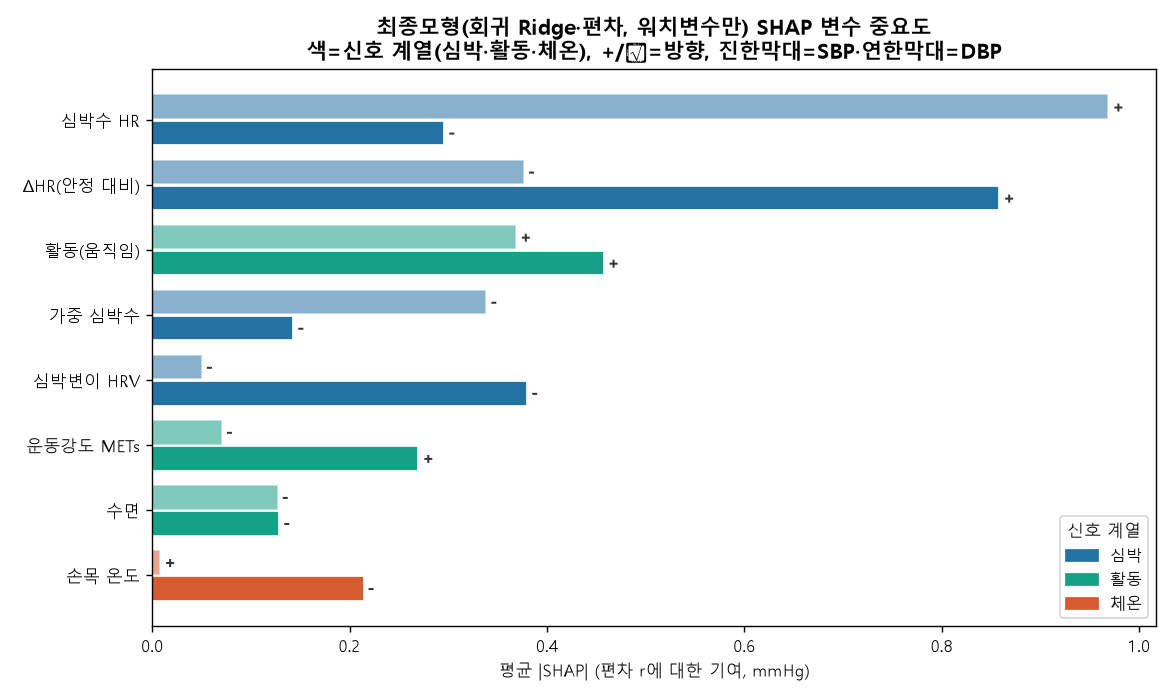
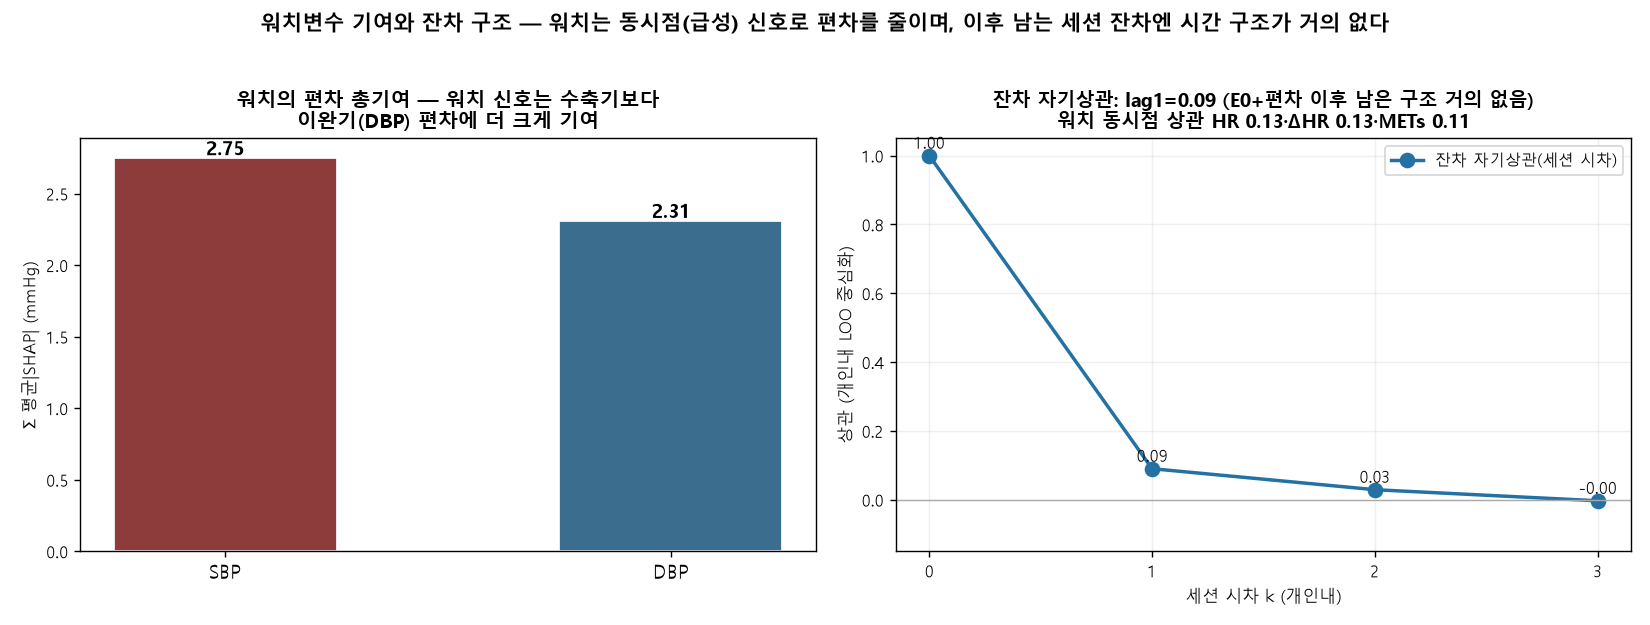
Attribution of the watch-only deviation model on the held-out test set (mean |SHAP| in mmHg) showed that cardiovascular arousal was the dominant driver. For the SBP deviation, the change in heart rate relative to resting (ΔHR) was the leading signal (0.86 mmHg), ahead of activity (0.46 mmHg) and heart-rate variability (0.38 mmHg). For the DBP deviation, heart rate ranked first (0.97 mmHg), followed by ΔHR (0.38 mmHg) and activity (0.37 mmHg). Heart rate and ΔHR therefore dominated both targets, and the wearable channel contributed more to diastolic than to systolic estimation. The reported signs are conditional, arising from a standardized multivariable fit rather than from marginal associations, and should be read accordingly. Little session-to-session structure remained after E0 plus the deviation term: the within-person residual autocorrelation was approximately 0.09 at lag 1 and near zero thereafter.
4.5 Summary of the session-level ceiling
Across methods, daily-average estimates consistently reached BHS Grade A, whereas session-level SBP plateaued near 5.8 mmHg, at the boundary of Grade B. This asymmetry reflects mean-regression toward each participant's set-point combined with an averaged circadian phase and a near-zero residual autocorrelation: aggregate wearable features with one-day calibration drive estimates toward the personal mean, which is accurate for daily summaries because intra-individual variance is small, but insufficient to resolve session-to-session SBP excursions. Attaining session-level Grade A would require information channels absent from the present feature set—raw photoplethysmography waveform morphology, a pulse-transit-time (PTT) timing channel, and periodic recalibration.
5. Discussion
5.1. Why daily-average estimates reach Grade A while session-level estimates stall at Grade B
The central asymmetry of our results is that daily-average estimates attained British Hypertension Society (BHS) Grade A (test systolic blood pressure [SBP] mean absolute error [MAE] 2.40 mmHg, diastolic blood pressure [DBP] 2.28 mmHg) whereas the corresponding session-level SBP estimate remained at Grade B (test 5.77 mmHg) even for the champion ridge model. This gap is a direct consequence of the variance structure of the reference data rather than a deficiency of any particular learning algorithm. The intraclass correlation coefficient (ICC) was high for both targets (SBP 0.72, DBP 0.63), indicating that between-person differences dominated the total variance and that the within-person temporal signal was comparatively small. After session-averaging, the within-person standard deviation (SD) was only 7.19 mmHg for SBP and 5.54 mmHg for DBP. When the available watch signals carry weak within-person temporal information, the loss-minimizing prediction regresses each estimate toward that person's set-point. Averaging many sessions cancels the zero-mean fluctuations around the set-point, so the aggregate target is recovered with high fidelity (Grade A); at the single-session level the same mean-regression leaves the moment-to-moment excursions largely unmodeled, and the residual error floor sits near the within-person SD itself. A further structural reason compounds this effect: because the estimation phase borrows an average circadian shape from the population age-by-sex cluster (blended with the sparse day-1 calibration points), it cannot reproduce a given day's specific excursions, so the structural estimate E0 = level + phase is smooth by construction and the deviation term must recover any day-specific departure from watch signals alone. Consistent with this, the within-person residual autocorrelation was only approximately 0.09 at lag 1 and near zero thereafter, indicating that little session-to-session structure remained to be exploited once E0 and the watch-driven deviation had been applied. In short, the model succeeds precisely where the variance to be explained is small and stalls where it is large but temporally unstructured.
5.2. What session-level Grade A would require
The implication is that aggregate watch signals combined with a single day of calibration cannot, even in principle, close the session-level SBP gap. The structural estimate alone (E0 = level + phase) already reached Grade A at the daily-average level (test SBP 2.41 mmHg, DBP 2.35 mmHg) and Grade B at the session level (test SBP 5.89 mmHg, DBP 4.83 mmHg); adding the watch-driven ridge deviation lowered the session errors only modestly (to SBP 5.77 mmHg and DBP 4.76 mmHg, with a harmonic-plus-ridge variant reaching Grade A for session DBP at 4.68 mmHg), without moving session SBP appreciably below the regression-to-set-point floor near 5.8 mmHg. Notably, removing the prior-BP-estimate features (past daily mean, previous-day same-time, and past same-time lags) from the deviation model barely changed accuracy, because E0 already carries each person's level and phase, rendering those autoregressive lags largely redundant; retaining only watch signals therefore keeps the model clean, avoids any feedback of the model on its own estimates, and leaves accuracy essentially unchanged. The literature indicates that session-level Grade A instead requires information channels that the present feature set does not contain: (1) raw photoplethysmography (PPG) waveform morphology, including systolic and diastolic peaks, the dicrotic notch, the augmentation index, the reflection index, and the second-derivative PPG (SDPTG); (2) a timing channel such as pulse transit time (PTT) or pulse arrival time (PAT), where PTT-based SBP estimation reaches a root mean square error of approximately 5.3 mmHg versus approximately 9.8 mmHg for PAT; and (3) periodic recalibration on at most a monthly cadence to offset drift of approximately 0.022 mmHg per day. A raw-waveform model such as PPG2BP-Net attains SBP 0.21 plus or minus 7.51 mmHg at Grade A, whereas validated smartwatches that rely on aggregate features regress toward the calibration set-point, over-estimating low pressures and under-estimating high ones. This is therefore a sensor and data limitation rather than a model limitation: the missing beat-level morphological and timing detail, not the choice of estimator, sets the ceiling.
5.3. Which watch signals carry the deviation, and comparison with the literature
Attribution of the watch-only deviation clarified which physiological channels drive the residual signal. On the held-out test set, cardiovascular arousal dominated: for the SBP deviation the change in heart rate relative to rest (ΔHR) was the leading contributor (mean absolute SHAP 0.86 mmHg), ahead of activity (0.46 mmHg) and heart-rate variability (0.38 mmHg); for the DBP deviation heart rate itself led (0.97 mmHg), followed by ΔHR (0.38 mmHg) and activity (0.37 mmHg). The watch channel thus contributed more to diastolic than to systolic deviation, consistent with the harmonic-plus-ridge model reaching Grade A for session DBP while session SBP remained at Grade B. Because these attributions come from a standardized multivariable fit, the estimated signs are conditional rather than marginal and should not be interpreted as simple bivariate associations. Two properties distinguish our findings from optimistic reports in the literature. First, our daily-average and structural estimates reach clinically meaningful accuracy: daily SBP and DBP satisfied Grade A, and the external-anchor level estimate (SBP MAE 6.61 plus or minus 0.78 mmHg) significantly improved on the cohort-cluster anchor (7.17 plus or minus 1.04, paired p = 0.001) and substantially on the population mean (10.05). Second, and equally important, these errors lie clearly below the naive within-person variability baselines, which establishes genuine information gain rather than mere recovery of a person-level constant. Session SBP error (test 5.77 mmHg) is below the within-person SD of 7.19 mmHg, and the daily-average errors are a fraction of it; the level estimate beats the population-mean reference by a wide margin. We further note that our day-split protocol is realistic: day 1 served only as a calibration anchor for the personal level and was never used as a training or evaluation target, while days 2–7 supplied all estimation train, validation, and test sessions under a person-level 60:20:20 split (72, 24, and 24 participants). Performance was computed exclusively at measured time points, with interpolation used only as features or intermediate targets and never as the evaluation ground truth, so the reported figures are not inflated by self-consistent interpolation.
5.4. Measurement noise and the irreducible-error floor
Part of the residual session-level error is irreducible because it originates in the reference itself rather than in the model. The protocol averaged two readings taken one minute apart, yet the single-reading measurement-noise SD was approximately 4.8 mmHg for SBP and 3.8 mmHg for DBP, and the first reading carried an alerting bias of plus 2.1 mmHg. Consequently an estimated 18–36% of the within-person SBP variance is attributable to measurement noise alone. A session-level MAE near 5.8 mmHg should therefore be read against a noisy target whose own short-interval reproducibility is limited; a substantial share of the apparent error reflects the stochastic component of cuff oscillometry rather than a systematic failure of the estimator. This reframes the Grade B session ceiling as partly a property of the ground truth: even a perfect physiological model could not drive the session error below the noise floor of the reference device, and the daily-average aggregation that yields Grade A also suppresses this measurement noise by averaging.
5.5. Multi-task versus single-task learning and the generalization lesson
The model comparison across twenty single- and multi-task families delivered a consistent regularization lesson. Tree ensembles and gradient-boosting methods achieved the lowest in-sample errors but collapsed out-of-sample: LightGBM, for example, reached a training session SBP MAE of 5.02 mmHg yet degraded to 6.63 mmHg on validation, a clear signature of overfitting to the small within-person signal. Linear and spectral estimators (ridge, harmonic-plus-ridge) generalized best and supplied the champion configuration, with validation session SBP MAE of 6.10 mmHg and daily-average Grade A on both targets (SBP 3.59 mmHg, DBP 2.29 mmHg). Multi-task formulations that jointly modeled SBP and DBP did not by themselves overcome the variance limit; their benefit, where present, came from shared regularization rather than from additional physiological information. The practical guidance is that, under high between-person and low within-person temporal variance, strong regularization and parsimonious linear or spectral models generalize more reliably than high-capacity learners, and that capacity should be increased only in proportion to the available data. These observations reinforce the broader conclusion that, absent richer waveform and timing inputs, model selection redistributes but does not remove the session-level ceiling.
5.6 Limitations
Several constraints qualify the present findings. First, the cohort was young and predominantly healthy: 120 participants with a mean age of 32.1 years (standard deviation 8.1, range 18–66), a mean body mass index of 22.7, and only 10 self-reported cases of hypertension, with reference systolic blood pressure of 113.0 mmHg (standard deviation 14.1) and diastolic of 74.5 mmHg (standard deviation 9.5). The narrow blood pressure range and the scarcity of hypertensive readings restrict generalization to older, comorbid, or pharmacologically treated populations in whom screening would carry the greatest clinical value, and they leave the high-pressure tail of the error distribution sparsely sampled.
Second, the deviation model consumed only aggregate wearable metrics—heart rate, the change in heart rate relative to resting, heart-rate variability, wrist temperature, activity and sleep flags, and metabolic equivalents—rather than raw photoplethysmography (PPG) waveform morphology or a pulse-transit-time (PTT) timing channel. As the literature and our own results indicate, this feature set caps session-level systolic accuracy near a mean absolute error of 5.77 mmHg, corresponding to British Hypertension Society (BHS) Grade B, because the structural estimate together with the watch-only deviation regresses toward each participant's set-point and borrows an average, population-cluster circadian shape that cannot capture a given day's specific excursions.
Third, session-level systolic estimation therefore attained BHS Grade B and should not be construed as standalone clinical measurement; the daily-average results, which reached Grade A, rather than the per-session systolic values, are the clinically meaningful outputs. Fourth, all results derive from a single dataset collected over one 7-day window with approximately five sessions per day, so temporal drift beyond a week and cross-device or cross-season transfer remain untested. In addition, all evaluation followed a within-person, held-out-person split, so transfer to entirely independent cohorts or acquisition settings is not directly established here. Finally, romanization of author names and institutional affiliations are to be finalized in the camera-ready version.
6. Conclusion
This study reframed cuffless blood pressure modeling as a single decomposition—person-level level, cluster circadian phase, and acute deviation—that unifies minute-level hybrid interpolation with minute-level estimation (nowcasting) under one structural estimator (E0 = level + phase) plus a watch-only deviation term. The person's level is anchored by a single day-1 calibration and an external population reference, and days 2–7 are used for estimation training, validation, and testing under a person-level 60:20:20 split (72/24/24 participants). Within this framework, daily-average estimation reached BHS Grade A on the held-out test set (systolic mean absolute error 2.40 mmHg, diastolic 2.28 mmHg), and session-level diastolic estimation also reached Grade A when the harmonic-plus-ridge configuration was used (4.68 mmHg).
Session-level systolic accuracy plateaued at Grade B (mean absolute error 5.77 mmHg), a ceiling we attribute to mean-regression under aggregate sensing and single-day calibration, to reliance on an averaged demographic circadian shape rather than a given day's specific excursions, and to near-zero within-person residual autocorrelation (approximately 0.09 at lag 1 and negligible thereafter), rather than to model choice—linear estimators such as ridge and harmonic-plus-ridge generalized best while tree and gradient-boosting families overfit (for example, LightGBM improved from a training session systolic error of 5.02 mmHg to 6.63 mmHg on validation). Among the watch signals, cardiovascular arousal was dominant, with heart rate and the change in heart rate above rest carrying the largest attributions, and the watch contributed more to diastolic than to systolic deviation. Reaching session-level Grade A will require richer sensing—raw PPG waveform morphology, a PTT or pulse-arrival-time channel, and periodic recalibration. By delineating what aggregate wearables can and cannot deliver, the study calibrates realistic expectations and offers concrete design guidance for the next generation of cuffless monitors (Table 1, Figure 1–3).
References
- O'Brien E, Petrie J, Littler W, et al. (1993). The British Hypertension Society protocol for the evaluation of blood pressure measuring devices. J Hypertens 11(Suppl 2):S43–S62.
↗ https://pubmed.ncbi.nlm.nih.gov/8158768/ - International Organization for Standardization. (2018). Non-invasive sphygmomanometers — Part 2 (ISO 81060-2:2018).
↗ https://www.iso.org/standard/73339.html - IEEE. (2014). Standard for wearable cuffless blood pressure measuring devices (IEEE 1708-2014).
↗ https://doi.org/10.1109/IEEESTD.2014.6882122 - Joung J, Jung C-W, Lee H-C, et al. (2023). Continuous cuffless blood pressure monitoring using PPG2BP-net. Sci Rep 13:8605.
↗ https://doi.org/10.1038/s41598-023-35492-y - Slapničar G, Mlakar N, Luštrek M. (2019). Blood pressure estimation from PPG using a spectro-temporal deep neural network. Sensors 19(15):3420.
↗ https://doi.org/10.3390/s19153420 - Kachuee M, Kiani MM, Mohammadzade H, Shabany M. (2017). Cuffless blood pressure estimation for continuous health-care monitoring. IEEE Trans Biomed Eng 64(4):859–869.
↗ https://doi.org/10.1109/TBME.2016.2580904 - Takazawa K, Tanaka N, Fujita M, et al. (1998). Assessment of vasoactive agents and vascular aging by the second derivative of the photoplethysmogram. Hypertension 32(2):365–370.
↗ https://doi.org/10.1161/01.HYP.32.2.365 - Block RC, Yavarimanesh M, Natarajan K, et al. (2020). Conventional pulse transit times as markers of blood pressure changes in humans. Sci Rep 10:16373.
↗ https://doi.org/10.1038/s41598-020-73143-8 - Vybornova A, Polychronopoulou E, Würzner-Ghajarzadeh A, et al. (2021). Clinical validation of the Aktiia optical blood pressure monitor. Blood Press Monit 26(4):305–311.
↗ https://pubmed.ncbi.nlm.nih.gov/33675592/ - Nachman D, Younis A, Eisenkraft A, et al. (2022). Wrist wearable cuffless blood pressure devices show insufficient accuracy. Front Cardiovasc Med 9:920946.
↗ https://doi.org/10.3389/fcvm.2022.920946 - Su P, Ding X, Zhang Y, et al. (2018). Long-term blood pressure prediction with deep recurrent neural networks. arXiv:1705.04524.
↗ https://arxiv.org/abs/1705.04524 - Imai Y, Hosaka M, Satoh M, et al. (2010). Day-by-day variability of blood pressure: the Ohasama study. Am J Hypertens.
↗ https://doi.org/10.1038/ajh.2010.166 - Liu X, Zhang D, Liu Y, et al. (2017). Dose-response association between physical activity and incident hypertension. Hypertension 69(5):813–820.
↗ https://doi.org/10.1161/HYPERTENSIONAHA.116.08994 - del Pozo Cruz B, Ahmadi M, Naismith SL, Stamatakis E. (2024). Daily step count and cardiovascular events in hypertension (UK Biobank). Eur J Prev Cardiol.
↗ https://doi.org/10.1093/eurjpc/zwae270 - Mukkamala R, Stergiou GS, Avolio AP. (2022). Cuffless blood pressure measurement. Annu Rev Biomed Eng 24:203–230.
↗ https://doi.org/10.1146/annurev-bioeng-110220-014644 - Mukkamala R, Hahn J-O, Inan OT, et al. (2015). Toward ubiquitous blood pressure monitoring via pulse transit time. IEEE Trans Biomed Eng 62(8):1879–1901.
↗ https://doi.org/10.1109/TBME.2015.2441951 - Schutte AE, Kollias A, Stergiou GS. (2022). Blood pressure and its variability: clinical relevance and application. Nat Rev Cardiol.
↗ https://doi.org/10.1038/s41569-022-00690-0 - Stergiou GS, Palatini P, Parati G, et al. (2021). 2021 ESH practice guidelines for office and out-of-office blood pressure measurement. J Hypertens 39(7):1293–1302.
↗ https://doi.org/10.1097/HJH.0000000000002843 - Parati G, Stergiou GS, Dolan E, Bilo G. (2018). Blood pressure variability: clinical relevance and application. J Clin Hypertens 20(7):1133–1137.
↗ https://doi.org/10.1111/jch.13304 - Elgendi M, Fletcher R, Liang Y, et al. (2019). The use of photoplethysmography for assessing hypertension. npj Digit Med 2:60.
↗ https://doi.org/10.1038/s41746-019-0136-7 - Ding X, Yan BP, Zhang Y-T, et al. (2017). Pulse transit time based continuous cuffless blood pressure estimation. IEEE Trans Biomed Eng 64(5):964–972.
↗ https://doi.org/10.1109/TBME.2016.2597879 - Mancia G, Kreutz R, Brunström M, et al. (2023). 2023 ESH Guidelines for the management of arterial hypertension. J Hypertens 41(12):1874–2071.
↗ https://doi.org/10.1097/HJH.0000000000003480 - Muntner P, Shimbo D, Carey RM, et al. (2019). Measurement of blood pressure in humans: AHA scientific statement. Hypertension 73(5):e35–e66.
↗ https://doi.org/10.1161/HYP.0000000000000087 - Liang Y, Chen Z, Liu G, Elgendi M. (2018). A new, short-recorded photoplethysmogram dataset for blood pressure monitoring. Sci Data 5:180020.
↗ https://doi.org/10.1038/sdata.2018.20 - Kario K. (2020). Management of hypertension in the digital era: small wearable monitoring devices. Hypertension 76(3):640–650.
↗ https://doi.org/10.1161/HYPERTENSIONAHA.120.14742 - Pandit JA, Lores E, Batlle D. (2020). Cuffless blood pressure monitoring: promises and challenges. Clin J Am Soc Nephrol 15(10):1531–1538.
↗ https://doi.org/10.2215/CJN.03680320 - American Heart Association. (2022). Cuffless blood pressure devices: a scientific statement. Hypertension 79(5).
↗ https://doi.org/10.1161/HYP.0000000000000209 - Korea Disease Control and Prevention Agency. Korea National Health and Nutrition Examination Survey (KNHANES), 2024 (HN24).
↗ https://knhanes.kdca.go.kr/
Note: All in-text numbers were computed directly from the provided data (N = 120) and analysis outputs. Bibliographic details and DOIs should be verified before submission. [author romanization, affiliation, and target journal to be finalized]